Capacity conversations fail for a predictable reason: buyer and manufacturer are each quoting a different number and neither says which. The manufacturer quotes a placement rate from the machine datasheet. The buyer hears a promise about delivery. The gap between them is changeover, derating and the bottleneck station, and the gap is where schedule risk lives.
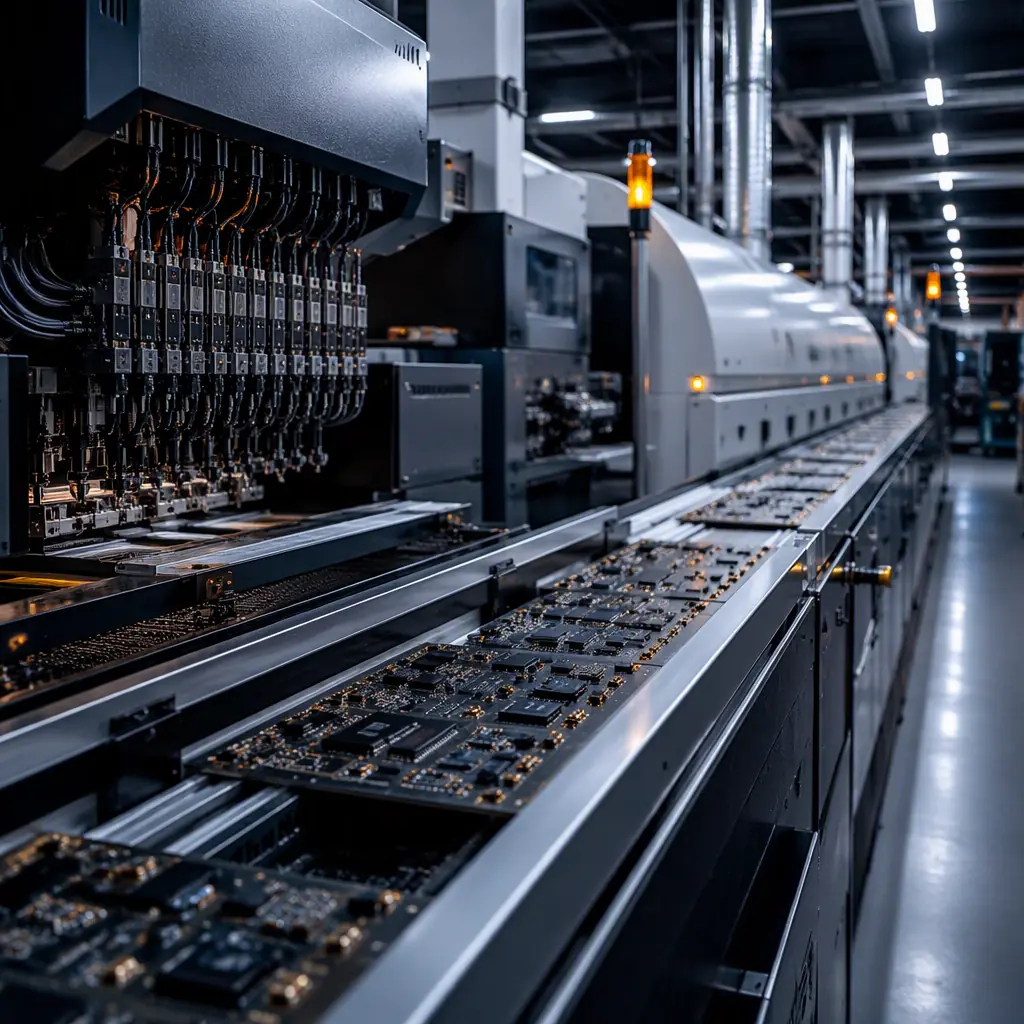
At Huaxing PCBA we plan across 8 SMT lines with a nominal combined placement capacity of 8M placements/day, running IATF 16949 and ISO 9001 processes. The nominal figure is a marketing number. The planning number is what comes out of the arithmetic below, and it is the only one worth putting in a delivery commitment.
Why the Datasheet Rate Is Not Your Capacity
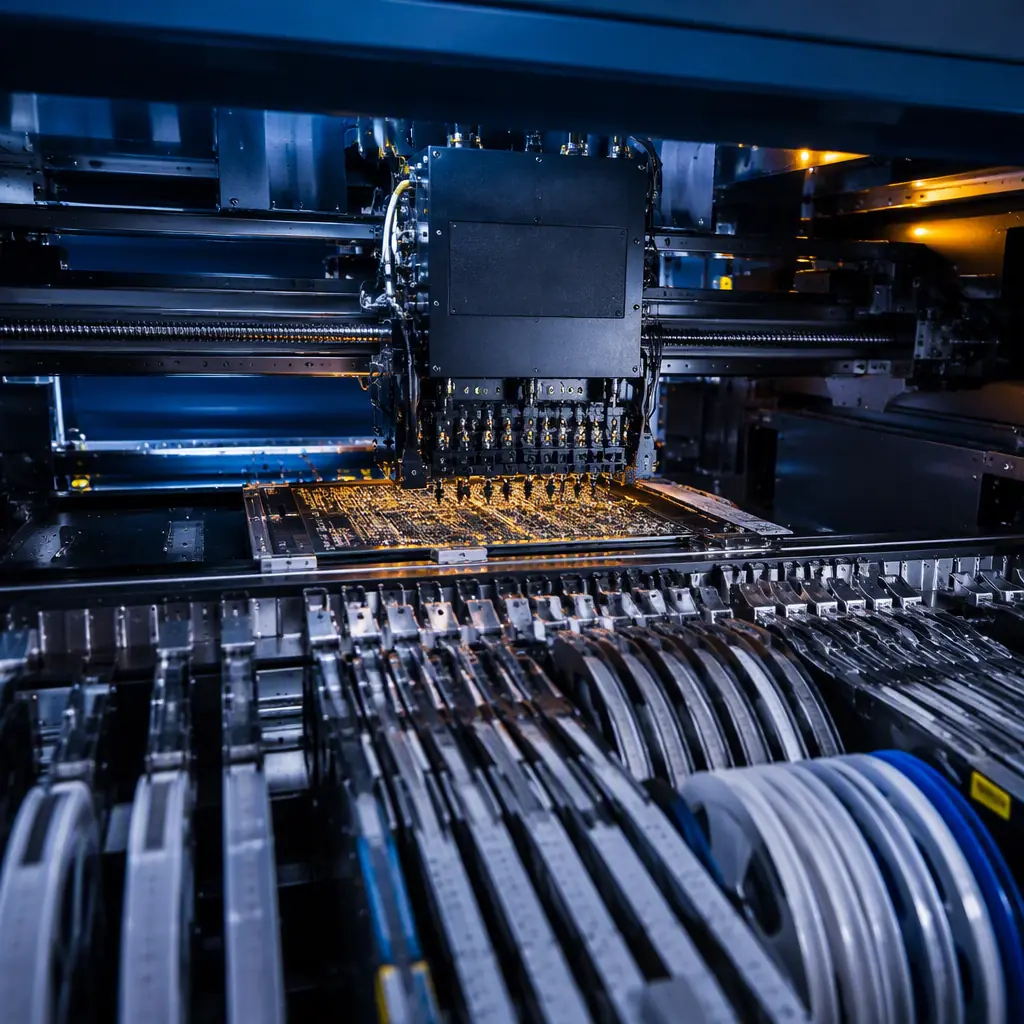
A pick-and-place machine rated at 60,000 components per hour achieves that figure under ideal conditions: optimal feeder arrangement, no vision failures, no nozzle changes, one product, and measuring only placement time. Real capacity is that number after four deratings:
| Derating factor | Typical effect | Cause |
|---|---|---|
| Effective placement rate | −30% to −50% | Vision alignment, feeder indexing, nozzle travel, mixed component sizes |
| Changeover and setup | −10% to −25% | Product switches, feeder loading, program changes, first-article checks |
| Availability and downtime | −5% to −15% | Maintenance, feeder jams, reflow profiling, material replenishment |
| Quality and yield losses | −2% to −8% | Rework loops, inspection holds, reflow touch-ups |
Multiply those together and a 60,000 CPH datasheet rate lands somewhere between 20,000 and 35,000 CPH of real, sustainable throughput. That is normal, not a problem. But it is a 40–60% difference, and it is the reason two manufacturers can both quote "60K CPH" and deliver very different schedules.
The Correct Capacity Formula
Boards per hour is not placement rate divided by components per board. Build it from the bottleneck station outward:
Step 1, Components per board. Count total placements per board, then convert to per-panel using the panelisation factor (boards per panel). Our panelization guide covers this step in detail.
Step 2, Effective CPH. Take the machine's rated CPH and apply the derating factors above. If you do not have historical data, use 50% of rated for a mixed-component board and 65% for a board with uniform, chip-only components.
Step 3, Placement time per panel. Components per panel ÷ effective CPH.
Step 4, Add non-placement time. Stencil print, SPI, reflow, AOI and load/unload each consume cycle time. On a typical line these add 30 to 60 seconds per panel, and longer if reflow is the constraint rather than placement.
Step 5, Apply OEE. Divide by your real Overall Equipment Effectiveness. A well-run SMT line runs OEE 70–85%; a line with frequent high-mix changeovers can sit at 55–65%.
Worked example for a mid-complexity industrial board:
| Step | Value |
|---|---|
| Components per board | 420 |
| Boards per panel | 4 |
| Components per panel | 1,680 |
| Rated machine CPH | 40,000 |
| Effective CPH (50% derate) | 20,000 |
| Placement time per panel | 1,680 ÷ 20,000 h = 5.0 min |
| Non-placement time | +0.75 min |
| Cycle time per panel | 5.75 min |
| Panels per hour (100%) | 10.4 |
| Panels per hour at OEE 75% | 7.8 |
| Boards per hour | 7.8 × 4 = 31 boards/hour |
Note the shape of the answer: 31 boards/hour is the real figure, and an 8-hour shift yields roughly 250 boards on one line, before any changeover. That is the number to plan against, and it is a long way from a naive 40,000 CPH ÷ 420 components = 95 boards/hour.
Shortcut: for planning estimates, take rated CPH, halve it, divide by components per board, then apply OEE. That single chain gets you within about 10% of the detailed calculation on most mixed-component boards.
Changeover: The Hidden Capacity Killer in High-Mix
On a single-product high-volume run, changeover is negligible. On a high-mix line it can consume a third of the available hours, and this is where most capacity surprises originate.
A typical stencil-based changeover costs 15 to 60 minutes: bring in the new stencil, load and verify feeders, change the program, run first-article inspection, adjust the reflow profile if the board is heavier or lighter, and clean the print head. A stencil-free changeover typically runs 0 to 10 minutes because there is no foil to swap and the program recall does the rest, see our stencil-free SMT guide.
| Scenario | Changeovers/shift | Hours lost (30 min avg) | Capacity retained |
|---|---|---|---|
| Single product, all shift | 0 | 0 | 100% |
| Low mix (4 products) | 3 | 1.5 | ~81% of 8h |
| Medium mix (8 products) | 7 | 3.5 | ~56% of 8h |
| High mix (12+ products) | 11 | 5.5 | ~31% of 8h |
The table is the reason high-mix work costs more per board even before material. It is also the strongest argument for stencil-free deposition in mixed-volume shops: cutting changeover from 30 minutes to 5 minutes returns ~3 hours per 7-changeover shift, which is a ~37% capacity recovery on that shift.
Finding Your Real Bottleneck
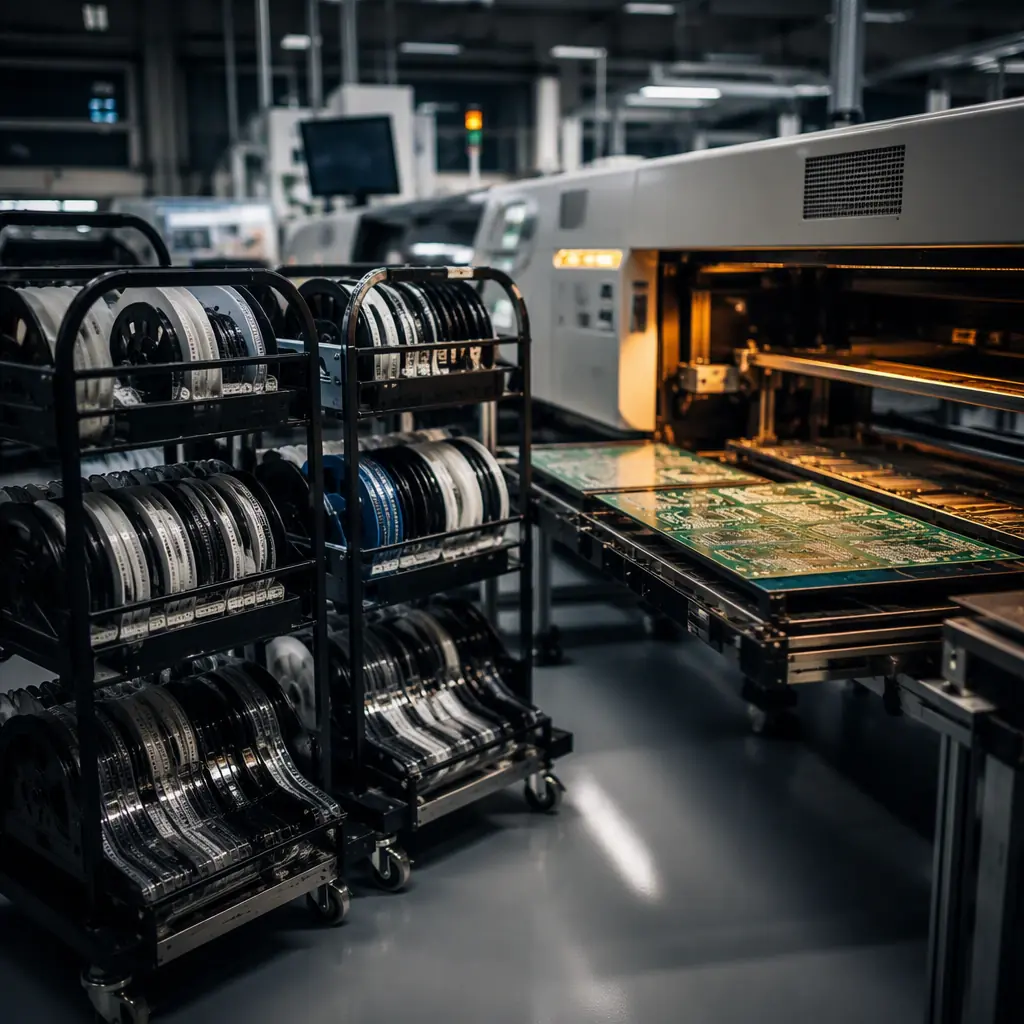
No line is faster than its slowest station, and the bottleneck moves with the product. The stations to compare:
- Stencil print / paste deposition . Usually 20–40 seconds per panel; constraining only on dense boards with tight print windows.
- Placement . Often the bottleneck on high-component-count boards, and the station most affected by derating.
- Reflow . Fixed by thermal profile, typically 4–8 minutes per panel in the oven. On small panels the oven is rarely the limit; on large, heavy, high-mass panels with long profiles it can become the constraint.
- AOI / inspection, 20–60 seconds depending on board complexity and whether X-ray is required for BGA or QFN.
- Through-hole / selective soldering . On mixed-technology boards this is frequently the true bottleneck because it is serial and hand-loaded. See double-sided & mixed-technology assembly.
Measure cycle time at each station for your specific product, then find the maximum. That maximum, not the placement rate, sets your boards per hour. Improving any other station does nothing.

Capacity Planning for a Buyer: What to Ask
If you are sourcing assembly and want a realistic delivery commitment rather than an optimistic one, ask for these five figures:
- Effective CPH on a comparable board, not the rated figure, ask what derating they apply and why.
- Changeover time per product switch, and how many switches your order implies.
- OEE on the line that will run your job, or at minimum a target range with the basis for it.
- Which station is the bottleneck for your board profile, a good partner knows this product by product.
- Queue position and current line load, so their lead time is anchored to something real. Our lead time reduction guide covers how to interpret and improve this.
A supplier who answers all five is planning capacity. A supplier who repeats a machine rating is reciting a datasheet. The difference shows up in week three of your production order. Our supplier quality scorecard covers the broader evaluation, and assembly cost breakdown explains how capacity and changeover feed into the price you are quoted.
Improving Capacity Without Buying Machines
Before capital, there are structural levers that raise real throughput on existing equipment:
- Increase boards per panel. Better nesting raises effective throughput on the same cycle time: often the single highest-return change. See panel utilization & nesting.
- Reduce changeover frequency. Batch high-mix work so similar products run consecutively, and use stencil-free deposition where changeover dominates.
- Rebalance the line. Move work off the bottleneck station, split placement across two machines, or pre-place a subset on a second line.
- Cut rework loops. Every rework pass consumes capacity twice, once for the original attempt, once for the correction. First-time-through yield is a capacity metric, not just a quality one. See solder joint defects.
- Improve DFM upstream. Designs that respect pad geometry, fiducials and panel utilisation run faster on the same equipment. See DFA rules.
The Bottom Line
Real SMT capacity is rated throughput after derating, after changeover, and after OEE. And it is capped by the bottleneck station for your specific board. The datasheet number is a starting point for the arithmetic, never the answer. Run the five-step calculation on your own board before you accept a delivery date, and ask your manufacturer for the derating assumptions behind theirs. The conversation that follows is where realistic schedules come from, and it is far cheaper than discovering the gap after the order is placed.