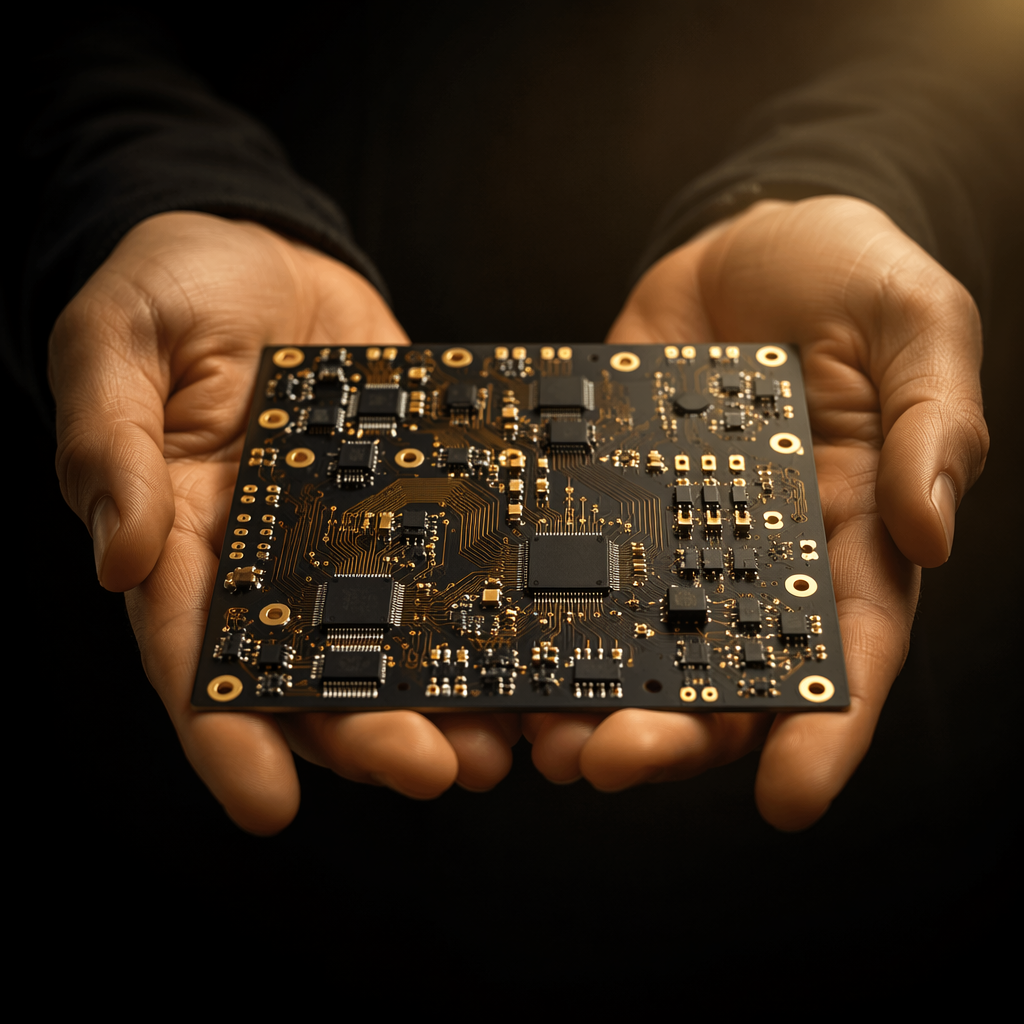

First pass yield is the percentage of units that come off the line and pass test without any rework, touch-up, or retest. It is the single number that best predicts what an assembly actually costs, because every unit that fails first pass has to be handled a second time: found, diagnosed, reworked, retested, and often scrapped anyway. A line running at 99% FPY and a line running at 92% FPY can have identical component costs, identical labour rates, and identical equipment, yet the 92% line ships the same order for materially more money. That gap is the entire business case for yield work.
This guide is the improvement half of the picture. If you need to know how to read and benchmark the number, start with SMT First Pass Yield — how to read, benchmark and diagnose losses. Here we assume you already know where your losses are and need to decide what to fix first. The answer follows a strict payback order, and the lever that feels most urgent to a struggling line is usually not the lever with the best return.
At Huaxing PCBA we run first pass yield as a tracked line KPI across 8 SMT lines under IATF 16949 and ISO 9001, and we report per-order FPY to buyers on request. The eight levers below are the ones that have moved the number for us, ordered by cost per point of yield recovered.

Why Yield Work Has to Be Sequenced, Not Random
The mistake most teams make is attacking defect types in the order they appear on the pareto chart. The pareto tells you which defect is most frequent, but frequency is not the same as cost. A single intermittent defect that scraps a $400 board at final test costs more than a thousand cosmetic defects that a five-second touch-up clears. Sequencing by frequency alone will have you chasing the wrong thing for weeks.
Sequence instead by cost per point of yield recovered. For each lever, estimate the yield points it is likely to return and divide that into the cost of implementing it. A paste-volume control loop that costs nothing to switch on and returns two points beats a new inspection station that costs six figures and returns one. This ordering is stable across product mixes, and it means the first three levers on the list below should be exhausted before anyone approves capital spending.
Key Takeaway: Rank yield projects by cost per point recovered, not by defect frequency. The cheapest levers are process-control changes that cost engineering attention but no capital, and they typically return the first three to five points. Capital equipment belongs at the bottom of the list, not the top.
The Eight Levers, in Payback Order
The following are the levers we pull in order. Each entry states what it fixes and roughly what it returns, so you can locate your own starting point.
Close the solder paste volume loop with SPI feedback
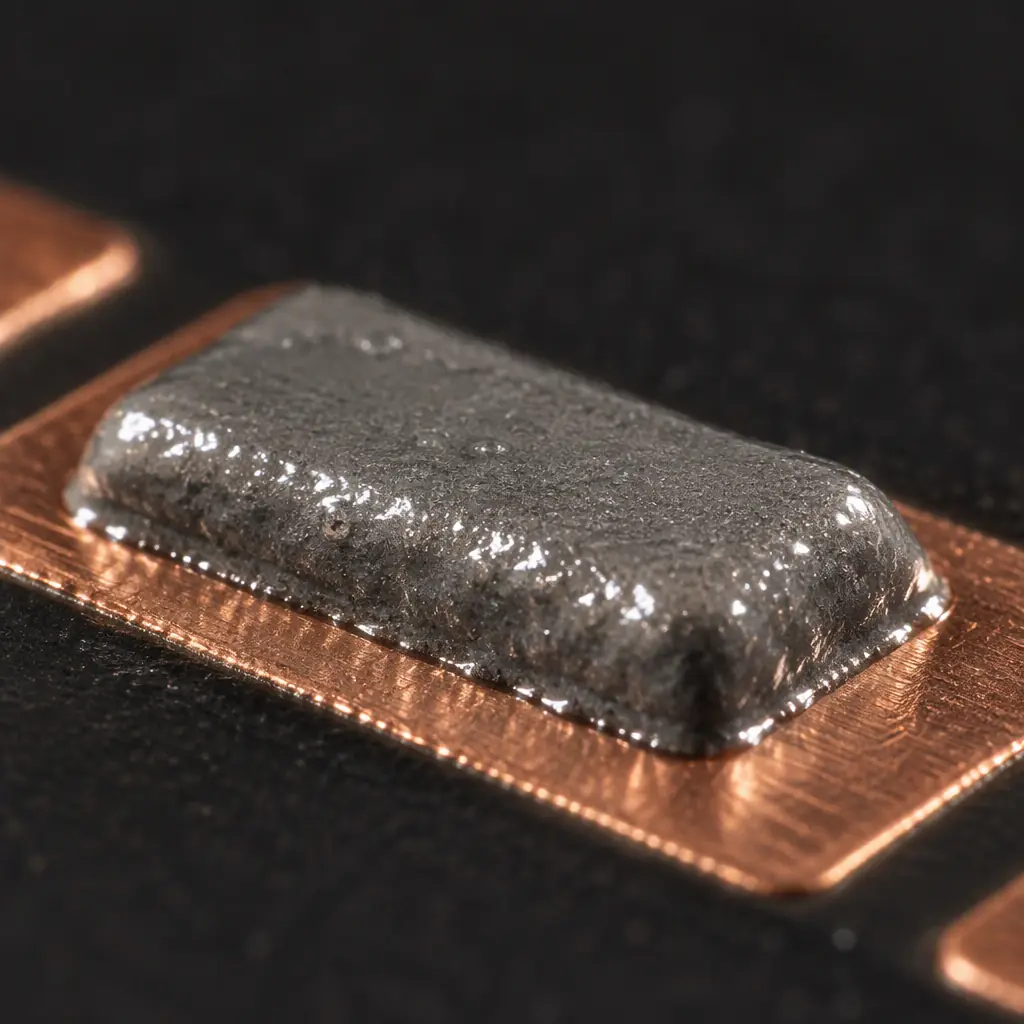
Solder paste volume is the largest controllable contributor to first-pass defects, and it is the one most often left open-loop. A stencil printer drifts: paste dries, the squeegee wears, the stencil underside clogs, and print volume creeps outside spec over a shift. If nothing measures that drift, the line discovers it at inspection or test, after the boards are built. Closed-loop printing means an SPI machine measures every pad volume, feeds the trend back to the printer, and lets the printer adjust automatically. This is the highest-return lever available and is usually the first three to five points. See solder paste volume and SPI process control for the control-loop mechanics, and solder paste printing defects for the specific failure modes the loop prevents.
Re-baseline the reflow profile per product, not per family
Most lines run one profile for a whole product family and accept the fallout. But the profile that suits a dense board with large thermal mass will over-cook a thin board with fine-pitch parts, and vice versa. Re-profiling each high-volume product with its own soak and peak-zone settings, verified with a profiler, removes a class of defects — non-wetting, tombstoning, cold joints — that no amount of inspection can catch after the fact. The cost is a few hours of engineering per product. The return is often one to three points on the products that were being mis-profiled. See reflow profile optimization.
Lock down stencil aperture design against the area-ratio rule
A stencil that cannot release paste cleanly will always print inconsistently, and no printer setting fully compensates. The governing number is the area ratio: the aperture opening area divided by the aperture wall area. Below roughly 0.66, paste release becomes unreliable and defects rise. If your fine-pitch apertures are below that ratio, redesigning them — or moving to a thinner foil — closes the defect source before it reaches the printer. See SMT stencil aperture design, and for the tooling options around it, zero-tooling and frameless stencils.
Control moisture before reflow, every time
Moisture-related defects — popcorning, delamination, voids over thermal pads — are entirely preventable and entirely invisible until they show up as field failures. Baking boards and components to J-STD-033 requirements before assembly, and controlling floor-life after bake, removes this whole category. The lever costs oven time and discipline, no capital. It matters most for products that go through multiple reflow passes or sit in humid environments. See solder voiding and x-ray acceptance for how the resulting void pattern shows up.
Fix thermal balance on heavy-copper and mixed-mass boards
Boards with mixed copper mass heat unevenly. One side of a connector reaches reflow temperature while the other is still climbing, and the result is a predictable set of defects: head-in-pillow, tombstoning, insufficient fill. Adding thermal relief on ground planes, balancing copper distribution at design, and slowing the ramp on the heavy side removes them. This lever often requires a design change rather than a line change, so it belongs on the next revision of the board rather than a running order.
Standardise component moisture sensitivity handling by MSL level
Not every part is equally moisture-sensitive. Treating an MSL 3 part and an MSL 6 part the same way either wastes effort on the robust part or under-protects the fragile one. Segmenting the bill of materials by MSL level and applying the correct floor-life rules per segment is what makes moisture control practical at volume rather than a paperwork exercise. See moisture sensitivity level handling.
Add automated optical inspection, then tune it weekly
AOI is the first lever on this list that costs real money, which is why it sits at position seven rather than one. Purchased before the process-control levers are pulled, AOI produces a high false-call rate that trained operators learn to over-ride — the machine becomes noise. Purchased after, it catches the escapes the earlier levers did not, and its programming can be tightened over time until it flags only genuine defects. See AOI, x-ray and SPI inspection for the role each station plays.
Add in-circuit or functional test coverage against the escape cost
The last lever is test coverage, and it is the least efficient way to buy yield because it detects rather than prevents. It still belongs on the list — some defects only appear at powered test — but it should be justified by escape cost, not by the desire to have a test. Adding an ICT or flying-probe stage to catch a defect that costs $50 to rework, on a board that sells for $20, does not pay. Run the numbers before you add a station. See flying probe vs ICT vs functional test and test coverage planning.
Costing the Improvement: The Only Formula You Need
Every yield decision reduces to a single comparison: the cost of the lever against the value of the points it returns. The value of a point of yield is not abstract — it equals the rework and scrap cost the point avoids, multiplied by the volume it applies to.
Work an example. A line builds 10,000 units a month at a $40 unit cost, running 93% first pass yield. Each failing unit costs $12 to rework and test, and 30% of failures are scrapped outright, losing the $40 material cost. At 93% FPY, 700 units a month fail. Of those, 490 are reworked at $12 (about $5,880) and 210 are scrapped at $40 (about $8,400), for a total failure cost near $14,280 a month. Push yield to 96% and failures fall to 400 a month, cost falls to roughly $8,160. The three-point improvement is worth about $6,100 a month, or $73,000 a year. A $30,000 SPI system that delivers those three points pays back in five months. A $200,000 inspection cell that delivers one point does not pay back at all.
| Lever | Typical FPY return | Cost type | Payback |
|---|---|---|---|
| SPI closed-loop paste control | 3–5 points | Capital (moderate) | 3–8 months |
| Per-product reflow profiling | 1–3 points | Engineering time | Immediate |
| Stencil aperture redesign | 1–3 points | Tooling | 1–3 months |
| Moisture control to J-STD-033 | 0.5–2 points | Process discipline | Immediate |
| Thermal balance redesign | 1–4 points on mixed-mass | Design cycle | Next revision |
| MSL-segmented handling | 0.5–1 point | Process discipline | Immediate |
| AOI with weekly tuning | Detects, not prevents | Capital (high) | Volume-dependent |
| ICT / FCT coverage | Detects, not prevents | Capital (high) | Escape-cost dependent |
Two things stand out in that table. First, the three highest-return levers are all process control, not equipment. Second, the two most expensive levers do not prevent defects at all — they find them. That is why capital spending on test equipment so rarely fixes a yield problem, and why the fix is usually already available on the line at a fraction of the cost.
What Raises Yield and What Merely Feels Like It
Some interventions reliably move first pass yield, and some are popular because they feel productive while changing nothing. Knowing the difference keeps a yield programme from burning out.
What works: measuring the input (paste volume, profile, moisture) rather than the output; making one change at a time and holding it long enough to see the trend; and reporting FPY by product and by line, so the improvement is visible and attributable. A yield programme without stable measurement is just noise-chasing.
What does not: buying inspection capacity to catch defects the process is still making; reacting to every defect with a new work instruction; and blaming operators for a process the process capability does not support. Reflow ovens, printers and placement machines are far more consistent than the humans tending them — if a defect recurs, the fix is almost always in the process window, not the person.
One more distinction matters at the buyer's level. First pass yield is not the same as outgoing quality. A line can have a mediocre FPY and a flawless outgoing quality, because the rework and retest catch everything before it ships. That is a valid strategy for low-volume, high-value products, and a disastrous one for high-volume products where rework cost dominates. Know which strategy your product justifies before you set a yield target. See outgoing quality control for the shipping-gate side of the equation.
Procurement tip: Ask any supplier for first pass yield by product, not a single site-wide average. A site-wide number hides the products the line struggles with, and those are the ones that will ship late or fail in the field. A supplier who can give you per-product FPY, per-line, is a supplier who actually measures it.
Setting a Yield Target That Means Something
A yield target should be derived from what the process is actually capable of, then set slightly above it to force improvement — not copied from an industry average that may not apply to your board. A four-layer board with 0805 passives and a 0.5 mm pitch QFN are not the same difficulty, and expecting identical yields from both sets the programme up to fail on the hard one and coast on the easy one.
Build the target from three inputs: the defect rate the process demonstrated on the last run, the physical difficulty of the board (finest pitch, smallest passives, thermal mass, number of passes), and the escape cost the product can tolerate. Then set the target at the demonstrated rate minus the recoverable losses the levers above can realistically return, and verify quarterly. A target that never changes is a target nobody is measuring.
Summary: The Order Matters More Than the Effort
Yield improvement is not won by working harder on defects — it is won by working on the right defect, in the right order. Closed-loop paste volume, per-product profiling, stencil aperture design and moisture control will return more points for less money than any capital purchase, and they should be exhausted first. Inspection and test are escape control, not prevention, and they belong at the bottom of the list where their payback shows for what it is.
At Huaxing PCBA we track first pass yield per order and per line across 8 SMT lines under IATF 16949 and ISO 9001, and we will share the FPY history for a comparable product on request so you can benchmark before you commit. Send your Gerber and BOM and we will confirm which levers apply to your build and return a quote with the process plan inside 24 hours, or talk to our engineering team about a yield problem you are chasing on a current product.