A paste printing defect is not a soldering problem and it is not a stencil problem. It is a process window problem, and the window has six inputs: the person running the line, the machine, the material, the method, the measurement system and the environment. When a buyer reports "your boards have bridging," the answer almost never comes from one of those six inputs alone. It comes from identifying which input moved, in what order, and whether the movement is still inside the window you agreed to.
This page is written for the person on the receiving end of that complaint, and for the buyer who has to decide whether to accept the supplier's explanation. It gives you an attribution method with numeric gates rather than a list of defect photographs, because a list tells you what a defect looks like and an attribution method tells you who has to fix it.
If you are looking for the per-defect cause-and-fix catalogue, our solder paste printing defects reference covers bridging, insufficient deposit, slump, smear and skips individually. This page covers the diagnostic layer above it.
What Counts as a Paste Printing Defect (And What Does Not)
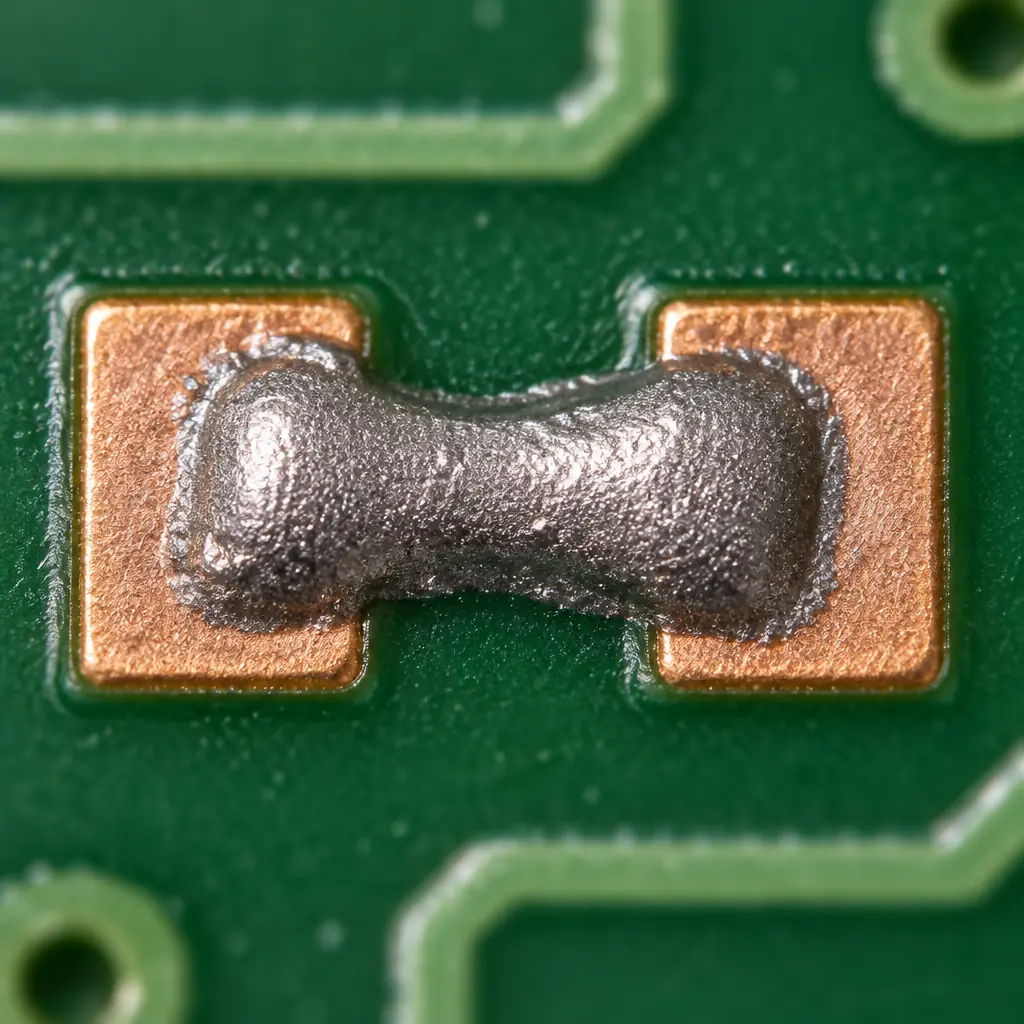
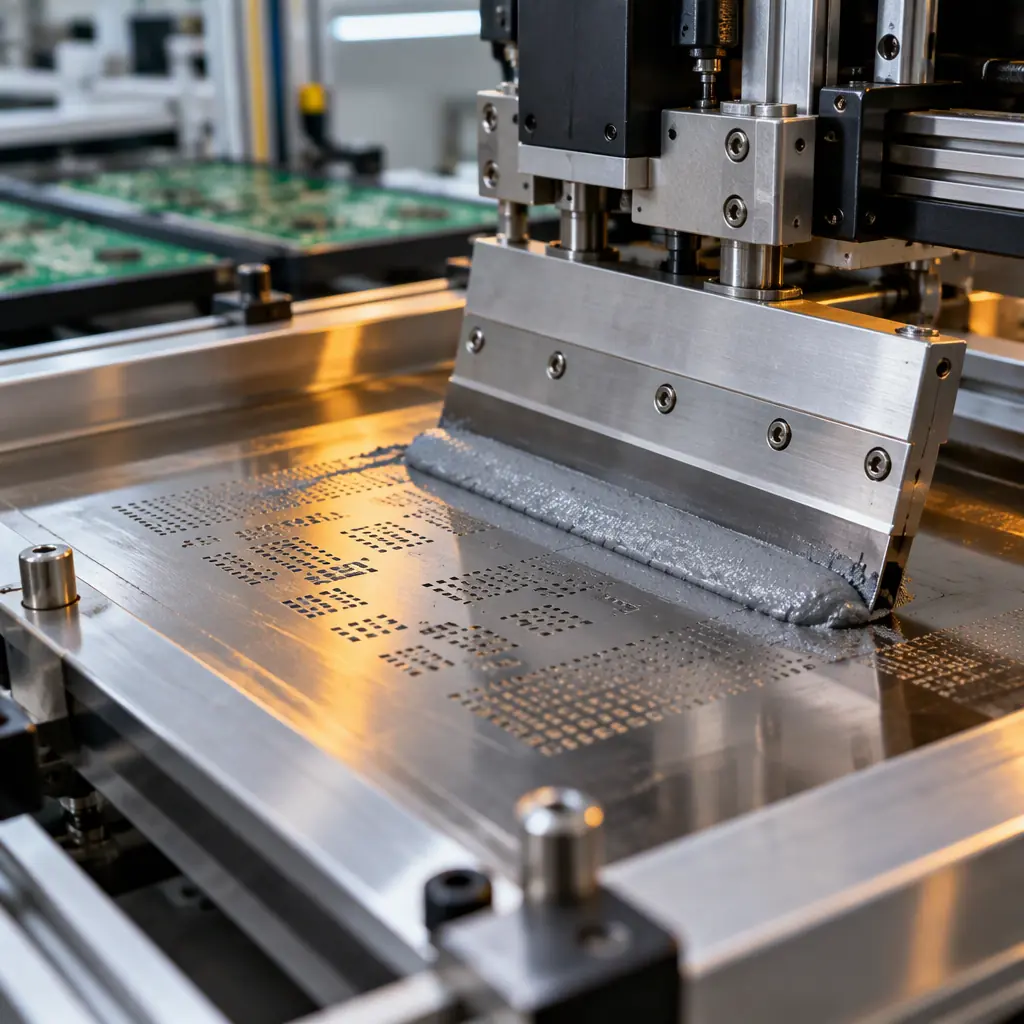
A paste printing defect is a deviation measured after deposition and before reflow: paste volume, area, height, position or shape outside the limit you specified for that aperture. It is a defect at the printing station even if the joint that follows is perfect. A solder joint defect is measured after reflow, and by then the printing evidence has been destroyed by the thermal cycle.
That distinction matters commercially. If a buyer rejects finished assemblies for bridging, the fabricator and the assembler can each plausibly claim the other's process caused it, and the physical evidence needed to settle it (the paste brick) no longer exists. The only way to settle it is to have measured the deposit before reflow and kept the record. In practice this means three gates:
- Area ratio ≥ 0.66 for every aperture, calculated as aperture opening area divided by aperture wall area. Below 0.66 the paste releases unreliably regardless of how the printer is set up. This is a design gate and belongs to whoever owns the stencil design, not to the printer operator. Our stencil aperture design guide covers the arithmetic aperture by aperture.
- Paste volume within −15% / +20% of nominal per aperture, measured by solder paste inspection (SPI). The asymmetric band is deliberate: insufficient paste is the dominant cause of weak joints and open circuits, excess paste mainly drives bridging and mid-chip solder balls.
- SPI process capability Cpk ≥ 1.33 on the volume distribution per aperture class, not on the board average. A board average can look healthy while every 0201 aperture is running 40% low.
When a supplier reports "SPI pass rate 99.6%," these three numbers are what you ask for next. A pass rate without the specification it was measured against, and without the Cpk behind it, is a marketing number. The measurement discipline is covered in our SPI paste volume control guide.
The Six-Input Attribution Matrix
Six inputs is the standard framing, and it is useful precisely because it forces you to check the two inputs people skip: measurement and environment. Run them in this order. The order is not arbitrary; it goes from the input most likely to be stable and cheapest to verify to the input most likely to have drifted.
| Input | What to verify | Numeric gate | Typical owner |
|---|---|---|---|
| Method | Stencil thickness, aperture area ratio, squeegee type, print parameters locked in a recipe | Area ratio ≥ 0.66; recipe version matches the approved one | Process engineering |
| Material | Paste lot, shelf life, thaw and open time, viscosity, alloy and powder size | Within manufacturer open time; viscosity within ±10% of lot certificate | Incoming material control |
| Machine | Squeegee pressure, print speed, separation speed, board support, gasket seal | Pressure 4–8 kg per 300 mm blade; support at 0.05 mm gap | Equipment engineering |
| Measurement | SPI calibration, gauge R&R, sampling plan, whether data is real or reconstructed | Gauge R&R < 10% of tolerance; SPI calibrated within 12 months | Quality |
| Environment | Room temperature and humidity at the press, paste on the stencil between prints | 22–26 °C; 40–60% RH; stencil dwell < 30 min between prints | Facilities / production |
| Person | Who changed the recipe, who cleaned the stencil, training record for that shift | Recipe change logged with name and reason; stencil cleaning per counter | Production supervision |
Two of these six inputs, method and material, are the ones a buyer can influence before the order is placed. The other four are the assembler's to hold. That split is what makes the matrix useful in a commercial dispute: it tells you which half of the problem you bought and which half you inherited.
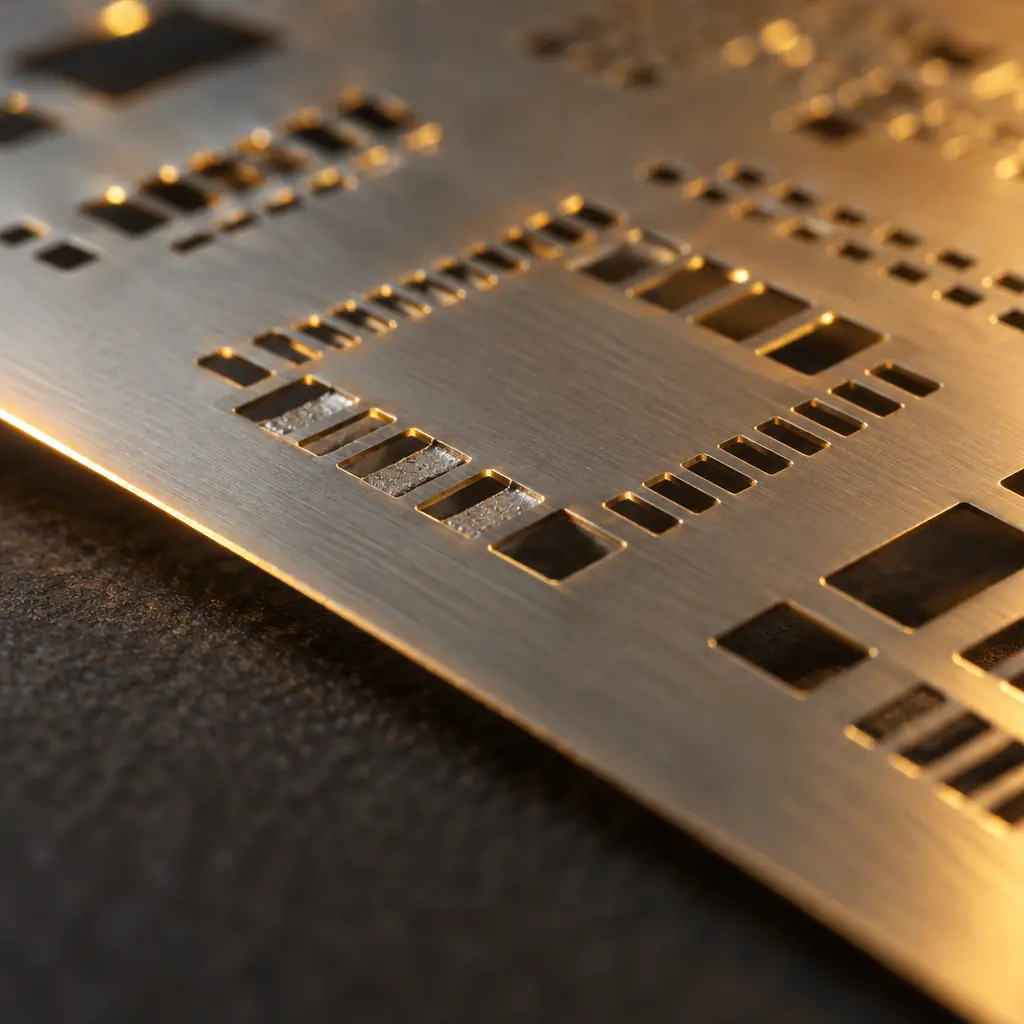
Method failures are the most common root cause in our own defect reviews, and they are almost always a stencil design issue rather than a printer setting. A 0.10 mm foil with 0.25 mm square apertures for an 0.4 mm pitch QFN has an area ratio of 0.625. No amount of squeegee pressure tuning fixes that; the foil has to be thinner or the aperture has to be redesigned. Buyers who specify stencil thickness in their assembly drawing without checking aperture area ratio routinely create this failure before the first board is built.
Bridging: Read The Bridge Shape Before You Read The Report
Bridging has four distinct physical signatures and each one points at a different input. Asking for a photograph of the bridge before accepting any explanation will resolve most disputes faster than any report.
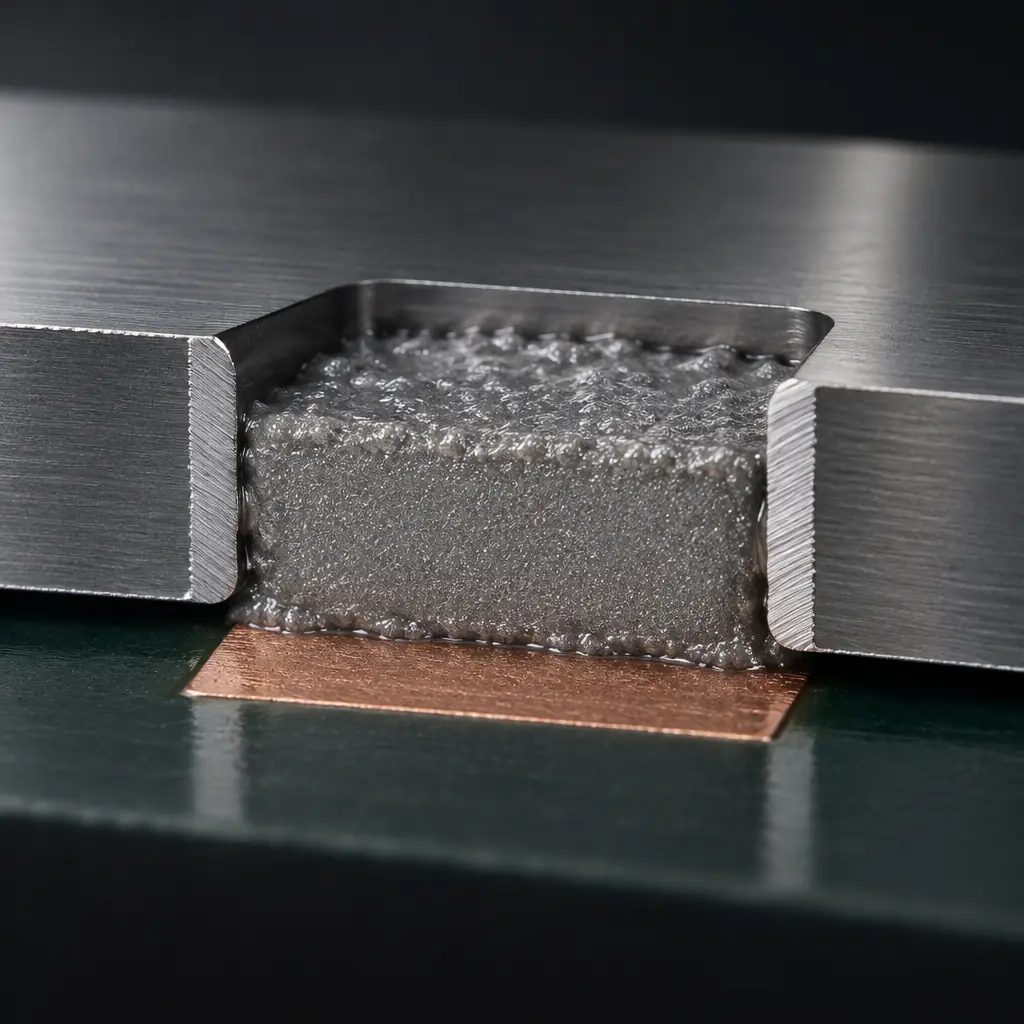
- A bridge that follows the gap between two pads with a smooth, continuous paste web indicates excess volume plus insufficient gasket seal. Check stencil tension and board support first; the paste is being pushed sideways under the foil rather than staying in the aperture.
- A bridge that appears as a ragged smear trailing off a pad indicates smear during separation: too fast a separation speed, or paste that has slumped because it sat on the stencil past its open time.
- A bridge between two apertures that are separated by less than 0.15 mm of foil web is a stencil design defect. The web is too narrow for the paste to shear cleanly. It belongs to the artwork and the stencil, not the printer.
- A bridge that appears only on one side of the panel indicates a support or levelling problem. The board is not flat against the tooling, so the gasket seal is asymmetric across the panel.
The 0.15 mm web figure is a working limit rather than a standard. It depends on foil thickness and paste powder size, and it should be verified against your own process, but it is the number we use to decide whether a bridging complaint is an artwork issue that needs a design change or a printer issue that needs a parameter change.
Insufficient Paste: The Defect Buyers Under-Report
Buyers notice bridging because it is visible and it shortens. Insufficient paste is quieter: it produces joints that pass visual inspection, pass functional test, and fail in the field six months later when thermal cycling opens a marginal fillet. In our experience it is the more expensive defect class by an order of magnitude, and it is the one that a pass-rate report hides most effectively.
The causes stack in a predictable order. First, aperture area ratio below 0.66, which reduces release efficiency. Second, paste viscosity that has risen past its working range because the stencil was left loaded between prints. Third, squeegee pressure too high, which scoops paste out of the aperture rather than rolling it across. Fourth, separation speed too high, which pulls paste back out of the aperture as the board drops away. Fifth, stencil underside contamination, which holds paste on the foil instead of transferring it.
The diagnostic that separates these five is a paste volume map rather than a single average. If insufficient deposits cluster at one region of the board, it is support or levelling. If they cluster on the finest apertures across the whole board, it is area ratio. If they cluster at the start of a print stroke, it is paste rheology or stencil cleaning. Our solder paste rheology guide covers the viscosity and thixotropy mechanism behind the second and third causes.
When The Supplier's SPI Data Is Self-Reported
Most assembly quotes include an SPI claim, and most of those claims are unverifiable as written. Three questions close the gap without requiring a factory visit.
- Ask for the raw volume distribution, not the pass rate. A histogram per aperture class shows whether the process is centred or whether it is running at the edge of the band with a few outliers pushing the average back inside. A pass rate of 99.6% with a bimodal distribution means two different processes are running on the same line.
- Ask what the specification was. Volume within −15%/+20% of nominal is a common shop default, but some lines run ±25% and still call it pass. The band width changes the pass rate more than the process quality does.
- Ask for gauge R&R on the SPI system. If the measurement system contributes more than 10% of the tolerance, the pass rate is partly measuring the measurement. Our gauge R&R guide for PCBA explains the calculation.
A supplier who can produce these three items on request is running a controlled process. A supplier who can produce only the pass rate is running a process that is being reported rather than controlled, and that difference shows up in first-pass yield at your end, not theirs.
Running The Audit On A Supplier Visit
The matrix is usable in a two-hour visit. You do not need to audit all six inputs in depth; you need to confirm that each one has a record and that the record has an owner. The sequence below takes roughly 90 minutes on a line running a similar product.
- Ask to see the recipe for the part number you buy. Note the version and the date it was last changed. Ask who changed it and why. No log means the method input has no control.
- Look at the stencil itself. Check tension, check the aperture edges for wear, check the stencil cleaning counter. Ask what the retirement criterion is. A stencil with a thousand prints and no counter is a method input drifting in the open.
- Ask for the paste lot certificate for the reel currently on the machine. Check the thaw time log and the open time. Paste that has been on the stencil for two hours has a different viscosity than the certificate describes.
- Watch one print cycle and time the separation. You are checking whether the machine runs the recipe the paperwork describes. A printed recipe and a different running setting is one of the most common findings.
- Ask the SPI operator to pull the last 20 boards' volume data. Look for the histogram, not the pass rate. Ask what happens when a board fails: sorted, reworked, or passed with a note.
- Check the room. A hygrometer on the wall reading 70% RH next to a press running water-soluble paste is a finding worth writing down.
None of these six questions requires specialist equipment, and any of them can produce a defensible observation. The point of the visit is not to catch the supplier out; it is to establish which of the six inputs has a documented owner, because that is the input that will hold when your volume ramps.
What To Write Into The Order
The commercial fix is to convert the matrix into three clauses, so that a future complaint has a reference rather than an argument.
Specification clause. State the paste volume band, the Cpk target and the aperture area ratio floor as acceptance criteria for the printing process, referencing the IPC class you are buying to. Our manufacturing tolerances guide explains how to phrase limits that a fabricator can actually hold.
Evidence clause. State what data accompanies each shipment: SPI summary per board or per lot, paste lot traceability, stencil revision in use. Evidence that is not in the contract tends not to exist at the moment you need it.
Attribution clause. State that paste defects measured before reflow are the assembler's responsibility and design-driven aperture defects are resolved by artwork change at the buyer's cost or the assembler's, depending on who owns the design. This clause is uncomfortable to negotiate and it is the one that prevents a six-week argument later.
First-pass yield numbers move when these three clauses are in place, because the process stops being reported and starts being controlled. Our first-pass yield diagnostic guide covers how to read the yield number once the printing process is under control, and which of the remaining losses are worth chasing.
The Four Numbers To Track Weekly
An attribution matrix is only useful if it produces a small number of indicators that move before the defect rate does. Four are enough for a printing line, and all four are cheap to record.
| Indicator | How it is calculated | Action threshold | What it predicts |
|---|---|---|---|
| Paste volume Cpk | Per aperture class, from SPI data over the last 200 boards | < 1.33 | Insufficient deposit and open joints will rise before the DPMO number does |
| Print-to-print variability | Standard deviation of volume for one aperture across 50 consecutive prints | > 8% of nominal | Machine drift, stencil wear or support degradation |
| Stencil print count | Counter reading against the retirement criterion | > 70% of rated life | Aperture wear, which is silent until it is not |
| Paste open time | Minutes from loading the stencil to the last print of that batch | > 4 hours for most no-clean pastes | Viscosity rise, slump and bridging |
These four are all leading indicators, which is the point. A defect rate is a lagging number that tells you what already shipped; a Cpk on paste volume tells you what is about to. When a supplier can show a trend on all four across the last three months, the process is being watched. When the answer is a single monthly pass rate, the process is being sampled, and sampling is what produces the surprise batch.
Three Attribution Mistakes Buyers Make
The buyer side of a paste defect dispute has its own failure modes, and they are worth naming because each one costs a week.
Attributing a design defect to the process. If the artwork has an aperture area ratio of 0.58, no process improvement will fix the deposit. The buyer specified the pad geometry and the stencil plan, so the fix is an artwork revision, and it is the buyer's change order. Rejecting lots built to approved artwork is expensive and does not converge. Our aperture design guide shows the calculation before the order is placed, which is where it belongs.
Accepting a defect rate without a denominator. "Three defects this month" is not a rate. Ask for defects per million joints or per million deposits, and ask which board population it covers. A rate on a low-volume prototype line and a rate on a 5,000-unit production run are not comparable, and quoting them against each other produces a false trend in either direction.
Treating an acceptable AQL as a control limit. AQL sampling accepts a defined number of defects in a lot; it does not describe process capability. A line running at Cpk 0.9 can still pass an AQL inspection on most lots and fail badly on a few. When you are buying a process rather than a lot, the Cpk is the number to negotiate, and AQL is the backstop.
The practical consequence is that a paste defect program needs two specifications: one for the process (Cpk, volume band) and one for the lot (AQL, sampling plan). Suppliers who are only asked for the second will only control the second.