
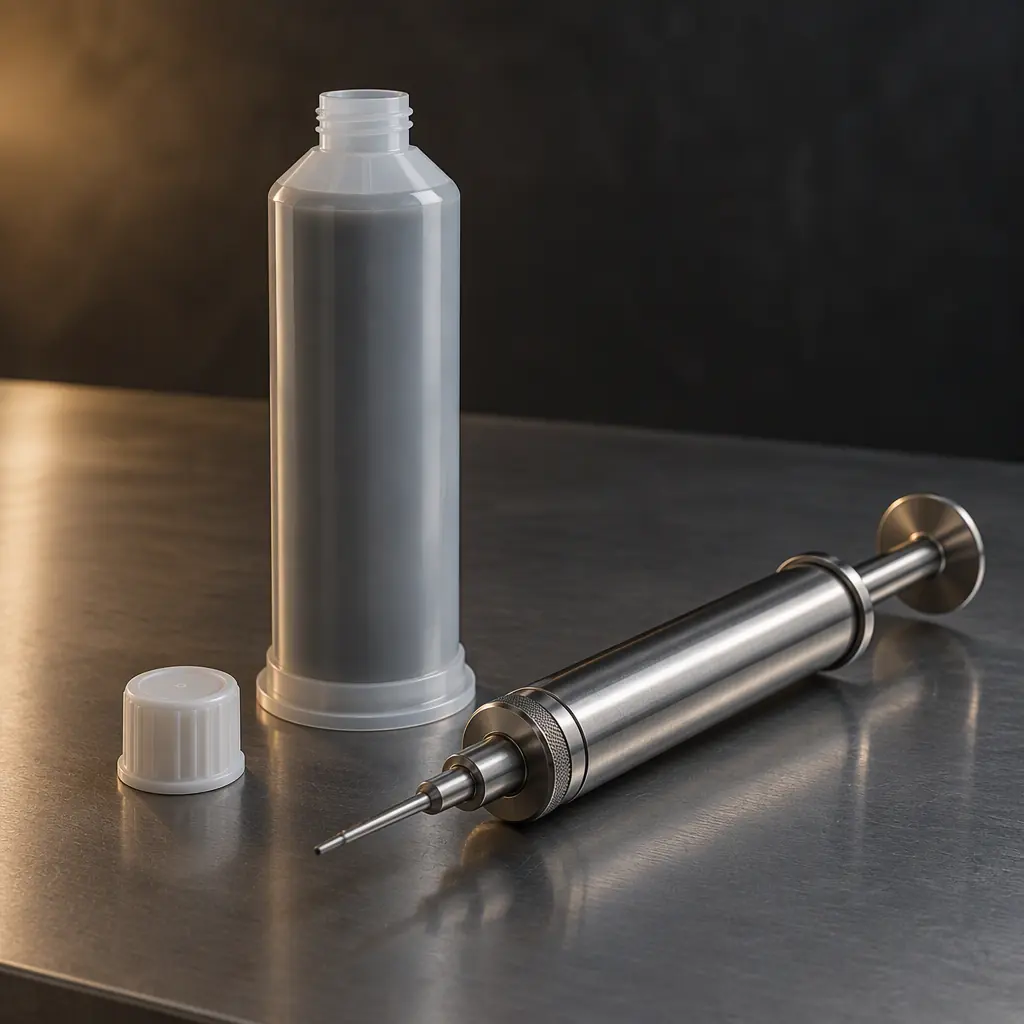
Solder paste appears on an assembly quote as a material line that is almost never itemised. It is folded into the per-joint or per-board assembly price, which means the buyer has no way to see whether the number reflects the physics of the board or a percentage margin. Paste is not a rounding item on a dense board: a 1,500-joint mixed-technology assembly can carry 1.5 to 2.5 grams of paste, and at a delivered cost of 0.10 to 0.18 US dollars per gram for a typical SAC305 Type 4 in a 500 gram cartridge, that is 0.15 to 0.45 dollars of material before any waste is counted.
Waste is where the number moves. Between 35 and 60 percent of a cartridge is not printed onto a board, and the share that is legitimately lost versus the share that is lost to process discipline varies enormously between lines. That spread is worth auditing because it is one of the few material costs a buyer can influence through specification.
This page sets out how to calculate grams per board from first principles, where the paste actually goes, which losses are unavoidable, and how to run a consumption audit that produces a number rather than an argument. Our solder paste selection guide covers alloy and powder choice; this page is strictly the economics.
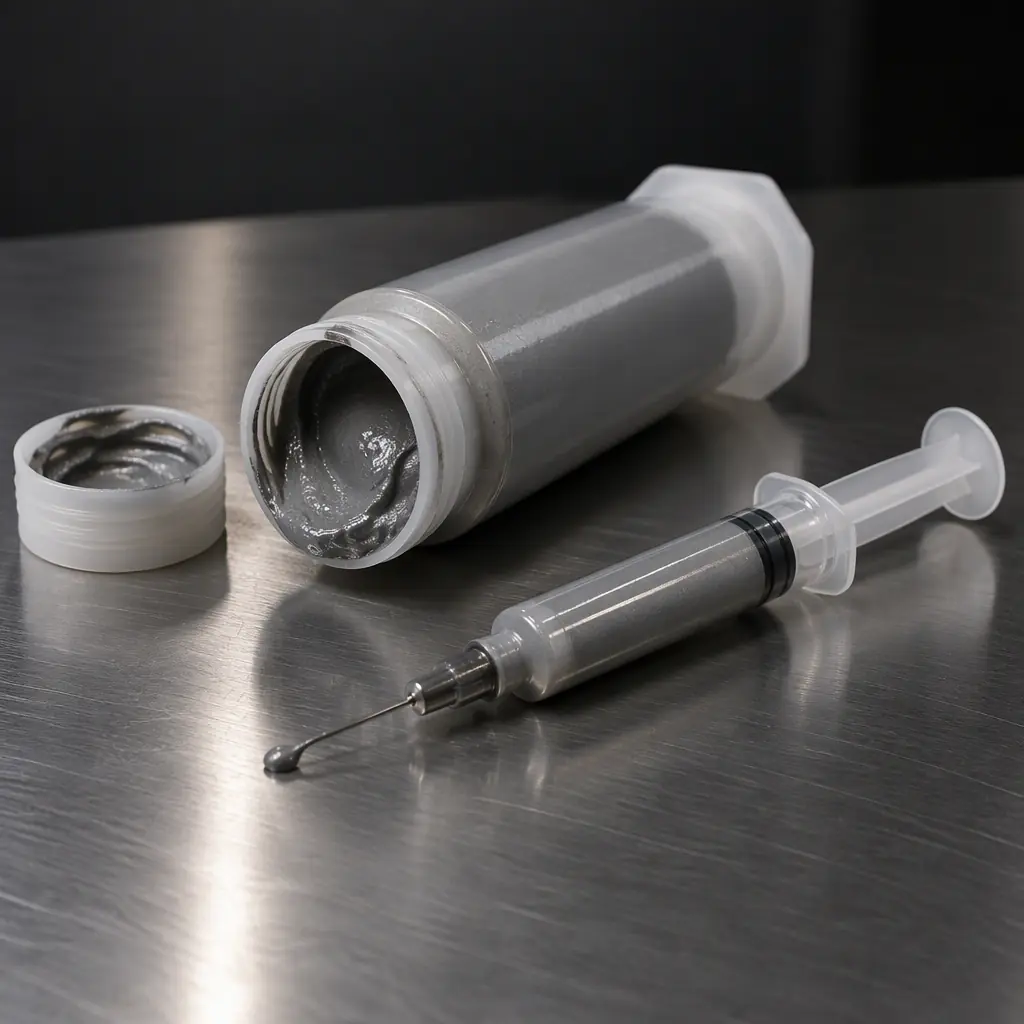
A cartridge is a consumable with a shelf life, a thaw clock and a working window. Each of those clocks imposes a real cost that does not appear on the invoice.
Grams per Board: The Calculation
The starting point is total paste volume per board, which is the sum of individual deposit volumes. Deposit volume equals aperture area multiplied by foil thickness multiplied by transfer efficiency, which the stencil foil thickness and paste volume guide covers in detail. Sum across all apertures on the panel, then divide by boards per panel.
Convert volume to mass using paste density. SAC305 paste at a metal load of 88.5 percent has a density of approximately 4.0 grams per cubic centimetre, dominated by the metal. The flux vehicle is much lighter, so paste density does not vary as much as intuition suggests: a change in metal load from 88 to 90 percent moves density by roughly 1.5 percent, not the 2 percent the load change implies.
| Board profile | Joints | Paste volume per board | Paste mass per board | Cartridge boards (minus 40 percent loss) | Material cost at 0.14 USD/g |
|---|---|---|---|---|---|
| Small 4-layer control board, 0603 passives | 180 | 0.012 cm3 | 0.048 g | 6,900 | 0.007 USD |
| General 6-layer industrial board, 0402 and QFN | 620 | 0.062 cm3 | 0.248 g | 1,340 | 0.035 USD |
| Dense 8-layer telecom board, 0201 and fine pitch BGA | 1,450 | 0.181 cm3 | 0.724 g | 460 | 0.101 USD |
| Mixed-technology board with pin-in-paste connectors | 980 | 0.245 cm3 | 0.980 g | 340 | 0.137 USD |
| LED lighting panel, 1.6 mm aluminium, large pads | 340 | 0.196 cm3 | 0.784 g | 425 | 0.110 USD |
The right-hand column is what the buyer actually cares about, because it turns a per-gram price into a per-board cost. On the dense telecom board, paste is 0.10 dollars a board; on a 5 dollar assembly that is 2 percent, which is material. On a 0.40 dollar simple control board the paste is 0.007 dollars, which is noise and should not be negotiated.
The panel divisor is the most common error
Consumption is measured on the panel; the buyer pays per board. If a panel carries four boards and the panel print consumes 0.40 grams, the per-board figure is 0.10 grams, not 0.40. Panels with high rails or large breakaway areas print paste onto pad arrays that exist only for tooling and test coupons, and that paste is genuinely consumed. A supplier quoting from a panel-level mass without dividing has inflated the figure by the panelisation ratio, which on a small board can be five or six times.
The panelisation and cost optimisation guide covers how rail and coupon design trades usable area against printing overhead. For consumption auditing, ask for boards per panel and the coupon pad area separately, so the coupon share can be subtracted if the contract excludes it.
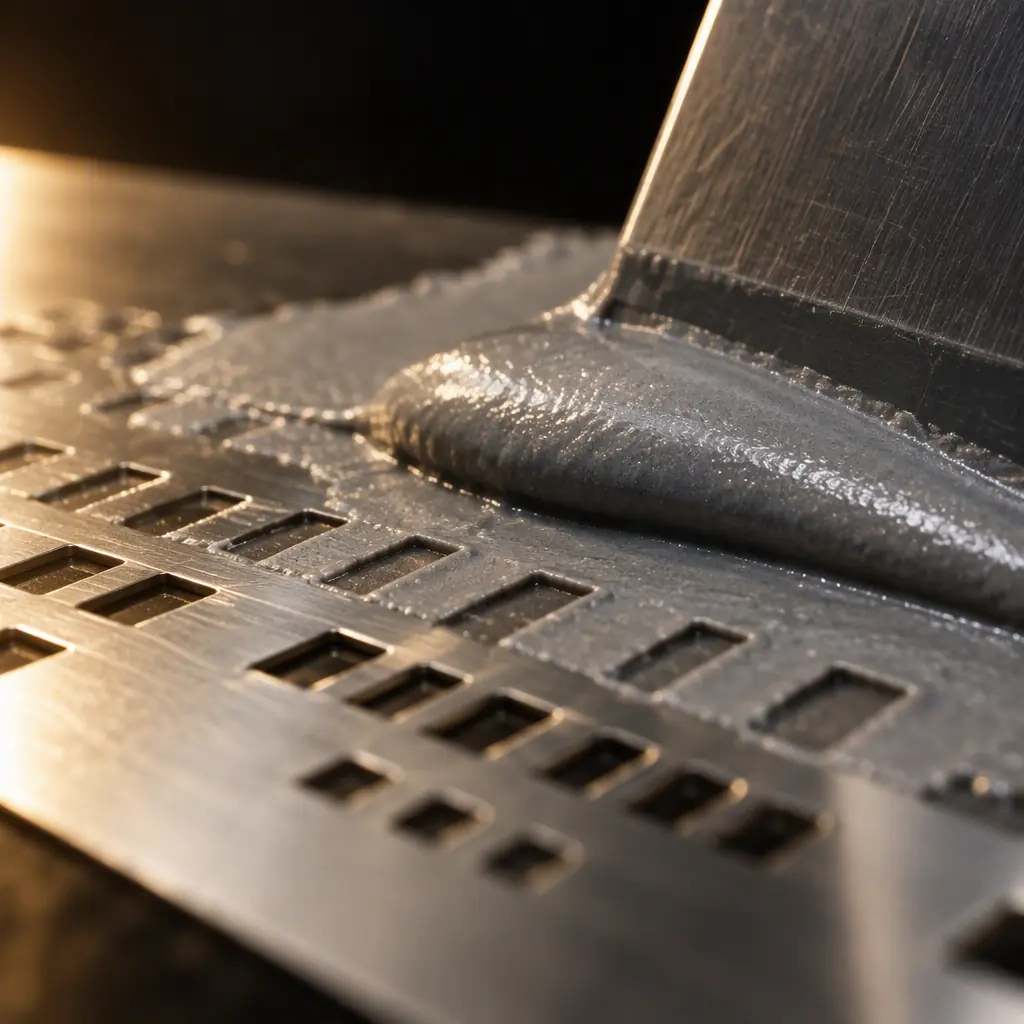
The rolling bead is working paste, not waste in the first pass, but it becomes waste when the run ends.
Where the Paste Actually Goes
Paste is lost in six places. Only the first is the intended destination. The other five are process physics with different degrees of control, and only three of them are the buyer's business.
| Loss channel | Typical share of cartridge | Legitimate? | Controlled by |
|---|---|---|---|
| Printed onto boards | 50 to 68 percent | Yes, intended | Aperture design and yield |
| Bead left on stencil at end of run | 8 to 15 percent | Partly, scales with batch size | Batch size and campaign planning |
| Aperture wall film and retained paste | 4 to 8 percent | Yes, tied to area ratio | Aperture design, coating |
| Stencil cleaning wipes and solvent | 3 to 6 percent | Yes, tied to cleaning frequency | Cleaning discipline and underwipe |
| Expired working life, dry-out, abandoned paste | 3 to 12 percent | No, this is the real target | Line discipline, stoppage control |
| Cartridge heel and transfer loss | 3 to 6 percent | Mostly yes, packaging dependent | Package format choice |
Add those shares and a well-run line prints 60 to 65 percent of a cartridge onto boards. A line with poor stoppage control and long batch changeovers prints 45 to 52 percent. The gap between those two is 15 percentage points of a consumable, which on a dense board is 3 to 5 cents a board and on a million-board programme is not nothing.
The abandoned-paste channel is worth dwelling on because it is the one with an obvious engineering fix. Paste has a working life; the number differs by formulation, but eight hours from thaw is a common conservative planning figure and many suppliers will quote four. Paste that has been in an open jar or on a stencil for longer than the working life is not merely degraded, it is a different material with different viscosity and slump behaviour. Printing with it produces a defect pattern that looks like a machine fault. The honest process discards it. The unmonitored process prints it.
Which Losses Belong in the Quote
The commercial question is not what the paste costs; it is which losses the buyer pays for. There are three defensible models, and they differ mainly in who carries the risk of a small batch.
Material pass-through at consumed weight
The supplier bills paste at a quoted unit price multiplied by grams actually consumed, with a stated maximum. Transparent, but it requires auditable consumption records and it rewards a supplier who consumes more unless the maximum is tight.
Material embedded in the per-joint price
The dominant model on assembly quotes. Paste cost is folded into a per-joint or per-board rate. Simple to administer, but the buyer cannot tell whether the folded figure assumes 60 percent cartridge yield or 45 percent. On low volume this is where an invisible 20 percent of material cost sits.
Setup-inclusive pricing with a stated batch floor
Paste for a run is quoted as a consumption allowance per batch, not per board. This is the fairest model for small batches, because the end-of-run bead is genuinely incurred once per batch and hardly at all as batch size grows. It only works if the batch floor is realistic and the allowance is itemised.
Mixing models is where quotes become incomparable. A quote that embeds paste in the per-joint rate, and also charges a "consumables" or "process materials" line, is charging twice unless the two are explicitly split. The line-by-line quote guide covers how to read a quote for double counting; paste is one of the four lines where it appears.
For small batches the honest answer is that paste cost per board rises steeply. A 20-board run still pays the end-of-run bead, the thaw cycle, and a proportion of a cartridge heel. On that basis the setup amortisation model for low-volume assembly is the right frame, and a supplier who quotes small batches at the same per-joint paste cost as volume runs is either subsidising the small batch or under-counting.
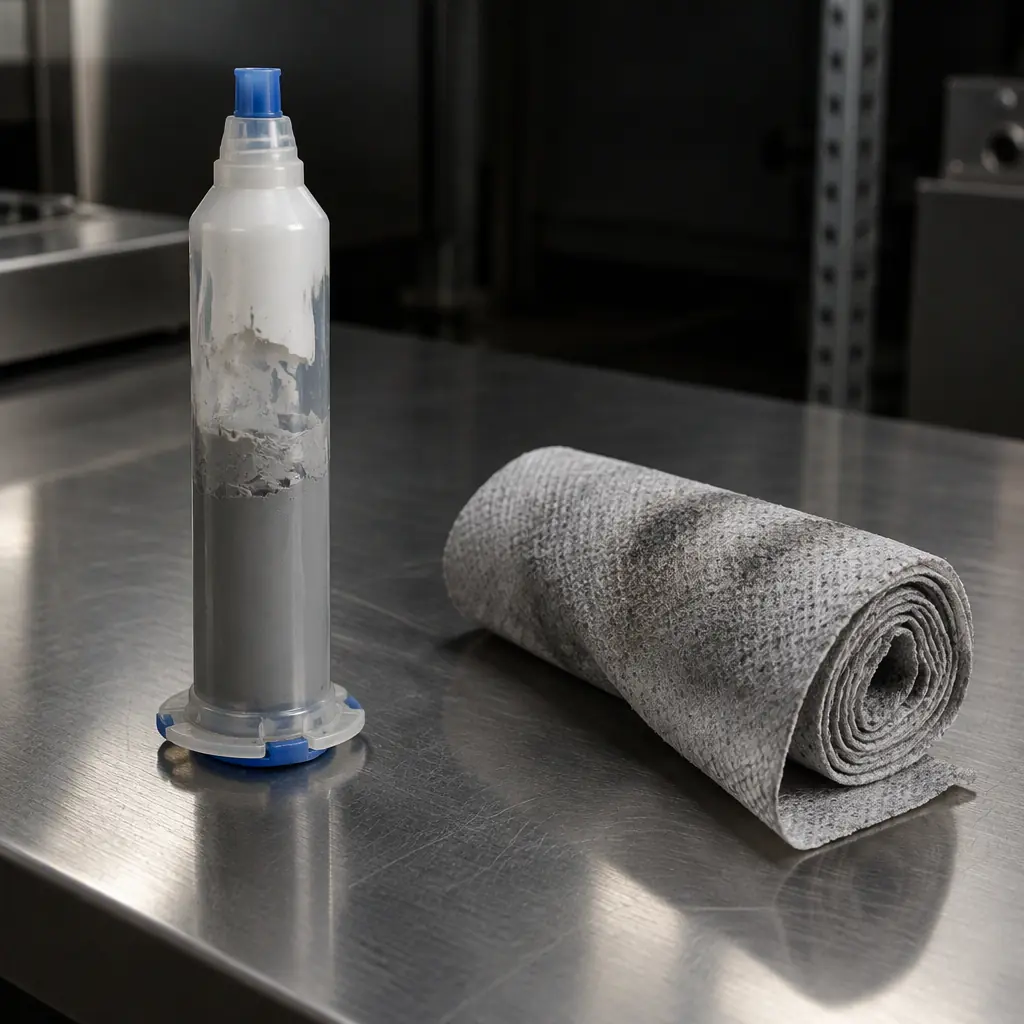
The heel and the wipes look like waste and mostly are. The expired paste in the same bin is the line's own loss.
Auditing a Consumption Claim in One Shift
A consumption audit does not need a week. It needs one shift, one batch, a scale and the batch records. The method is a mass balance: weigh paste in, weigh boards and waste out, and reconcile the difference. If the supplier claims a consumption figure, the audit tells you whether it is achievable on that line for that board.
Weigh the cartridge before thaw and after the run
Include the cartridge mass in the tare. Record the number to 1 gram on a scale with 0.1 gram resolution. Two cartridges on the same batch is normal and both should be weighed.
Count boards printed and rejected at print
Boards rejected at print consumed paste and must be counted in consumption, or the per-board figure silently excludes scrap paste. This is where a supplier's number and a buyer's expectation usually diverge.
Weigh the end-of-run bead and the wipes bag
Both are waste channels that should be counted. Weighing the bead is the clearest single indicator of batch-size efficiency; on a 20-board run it can be a third of the cartridge.
Reconcile against theoretical printed volume
Theoretical paste onto good boards, in grams, computed from aperture area and thickness. If actual consumption exceeds theoretical by more than 60 percent, either the loss channels are undisciplined or the theoretical figure is wrong. Both are worth knowing.
Record the working-life clock from thaw to last print
The elapsed time from thaw to the last print of the batch is the single strongest predictor of abandoned paste. Anything over eight hours on a normal formulation should be explained.
The output of the audit is one number: grams consumed per good board. That number, multiplied by the paste unit price, is the true material cost, and it either matches the quote's assumption or it does not. The exercise also produces a side benefit: batches where the audit ratio is poor are usually the same batches that produce print defects, which makes the audit a quality tool as well as a cost tool. The solder paste defect attribution method uses the same records.
A worked reconciliation from a mixed-technology audit
A 240-board batch of an 8-layer board with 980 joints: 1,000 grams of paste issued across two cartridges, 168 kilograms of boards produced, 6 boards rejected at print. Theoretical paste onto good boards was 0.235 kilograms. Cardridge difference, bead and wipes accounted for 0.61 kilograms. The residual 0.16 kilograms, about 16 percent of issue, was expired paste from a four-hour line stoppage. That single event was worth more than every other loss channel combined on that batch, and it was a scheduling problem, not a materials problem.
Powder Type and Alloy Change the Unit Economics
Two specification choices change cost per board without changing the printed volume. The first is powder type. Type 4 costs more per kilogram than Type 3, and Type 5 more again, because the powder yield in atomisation falls as particle size drops. Moving to a finer powder for a fine pitch board is a real cost increase on paper and a saving in practice if it removes a defect rate, but the comparison has to include the defect rate, not just the price per kilo.
| Specification change | Effect on unit price | Effect on consumption | Net effect on cost per board |
|---|---|---|---|
| Type 3 to Type 4 | +6 to 12 percent per kg | Slightly higher volume per aperture due to packing efficiency | Up 5 to 10 percent |
| Type 4 to Type 5 | +15 to 25 percent per kg | Higher slump risk, more cleaning | Up 15 to 30 percent |
| SAC305 to low-silver SAC (e.g. SAC0307) | Down 8 to 15 percent per kg | Similar volume, narrower process window | Down 5 to 12 percent, with risk |
| No-clean to water-soluble | Similar per kg | Higher cleaning and waste water cost | Up, but combined with total cleaning cost |
| Barrel cartridge to syringe or jar | +20 to 40 percent per kg | Far higher heel and dead volume | Up sharply on small batches |
The second choice is packaging format. A 500 gram cartridge with a follower plate leaves a modest heel. A 30 millilitre syringe for a prototype batch leaves a much larger heel as a percentage, and the paste is also sold at a higher unit price. For prototype quantities the packaging dominates the cost, which is why the low-volume assembly model treats paste as a fixed per-batch cost rather than a per-board one.
There is one specification change that reduces consumption without touching the alloy: nano-coated stencils. The coating reduces paste retained on the aperture wall, which raises transfer efficiency at small apertures by 8 to 12 percentage points in practice. That is displaced volume that would otherwise stay on the foil and be wiped off. The stencil design guide covers the coating selection.
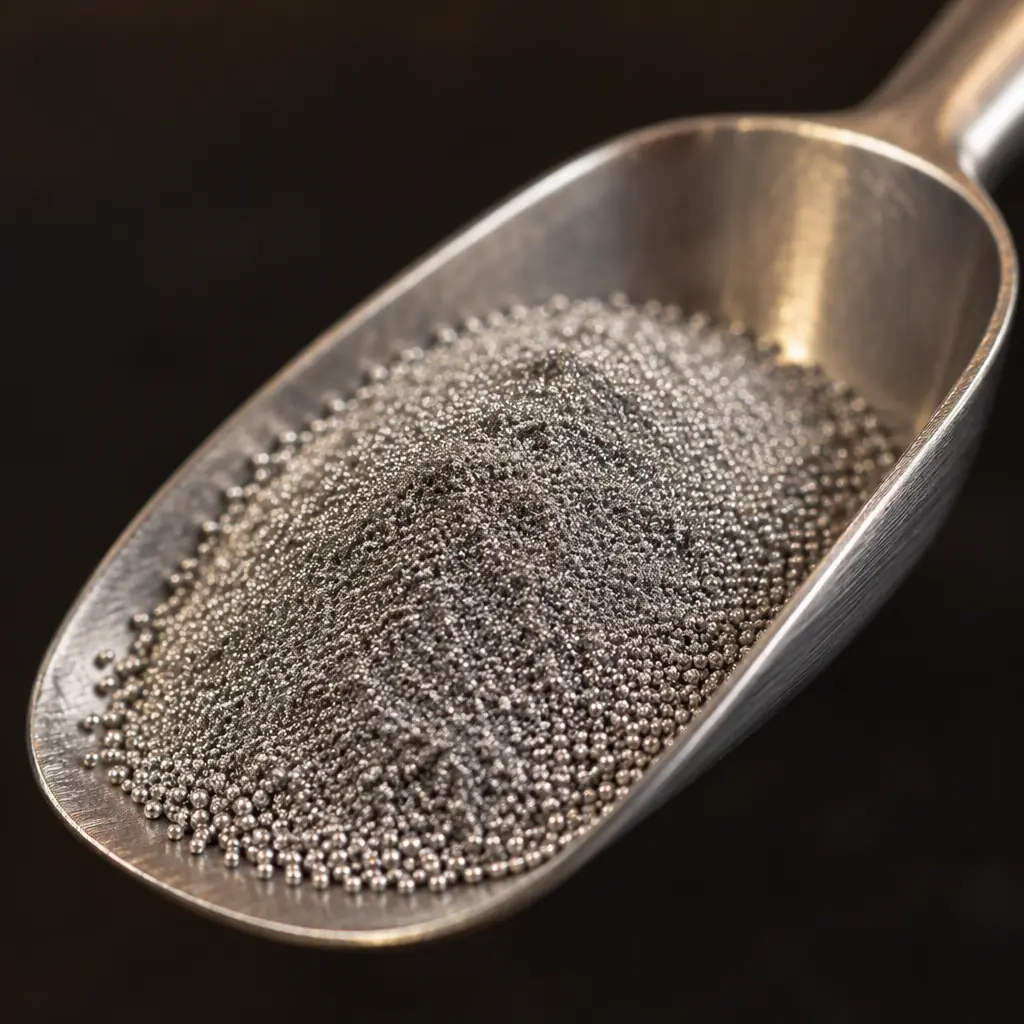
Powder cost scales with fineness because atomisation yield falls. It is the least visible line in the paste price.
What to Put in the Purchase Order
Three clauses cover 90 percent of paste-related disputes, and they are short enough to add to an existing terms sheet without a renegotiation.
Consumption allowance stated per batch, not per board
For batches under 500 boards, state the paste allowance in grams per batch with a stated batch size. This aligns the supplier's exposure with the actual physics: one bead, one heel, one thaw cycle.
Expired paste prohibition with a record
State that paste beyond its stated working life is not to be used, and require the working-life record to be retained with the batch record and available on request. This converts a quality preference into an auditable condition.
Substitution approval for alloy or powder type
Silent substitution from SAC305 to a low-silver alloy reduces material cost and narrows the reflow window. Require written approval for any change of alloy, powder type or metal load, tied to the second source approval workflow for the assembly materials.
The alloy clause matters more than it looks. Paste alloy is not always verified at goods-in; the alloy verification by OES and XRF method shows how a lot can be checked, and paste is one of the materials where a supplier swap is easy and hard to notice from the joint appearance.
Finally, the cost is worth putting in perspective. On a dense board, paste is 2 to 4 percent of assembly cost. The same board's paste-related defects, if uncontrolled, can cost 5 to 15 percent of assembly cost in rework and scrap. Negotiating grams down while leaving working-life control unspecified is optimising the smaller number. Get the control right and the consumption figure tends to fall on its own.
If you want the consumption actually used on your last batch, ask for the grams issued, the boards produced and the print reject count. Those three numbers should reconcile within a couple of percent, and if they do not, the reason is worth knowing before the next order.