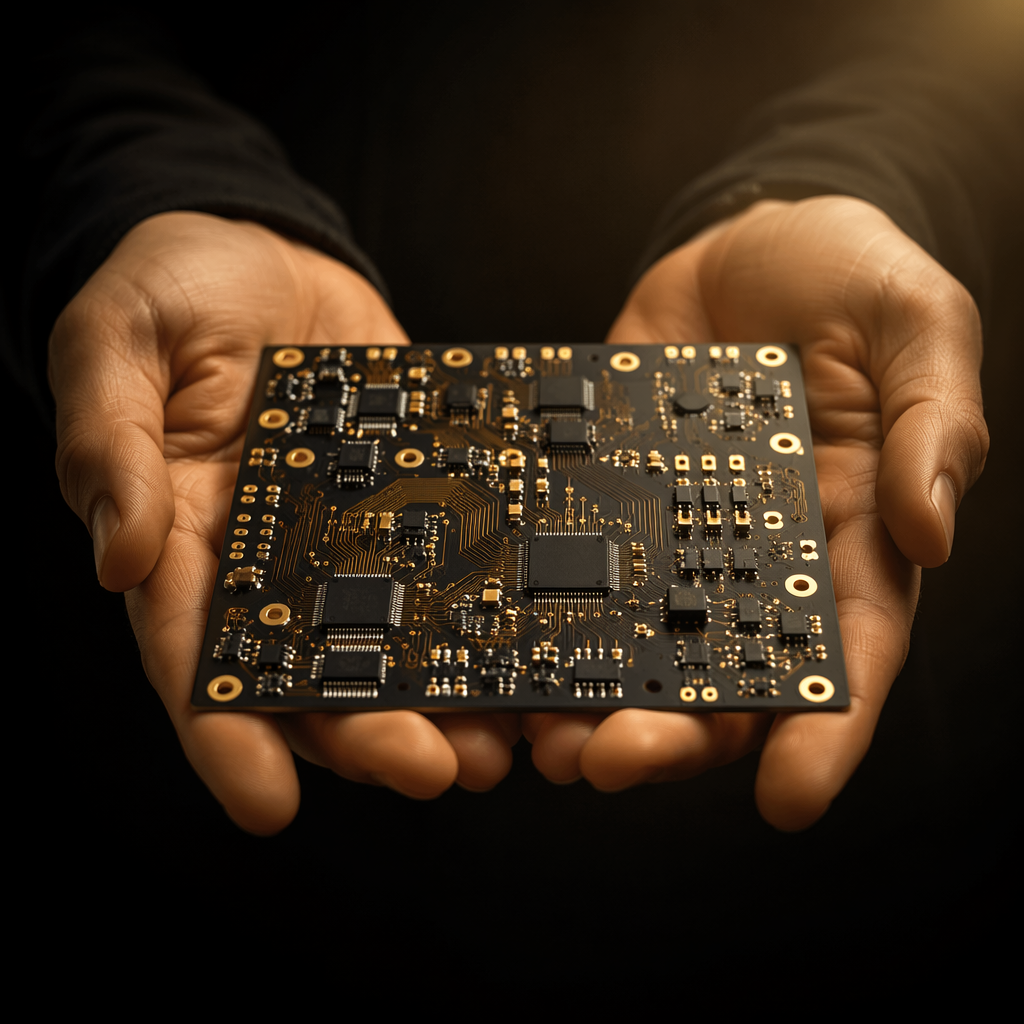
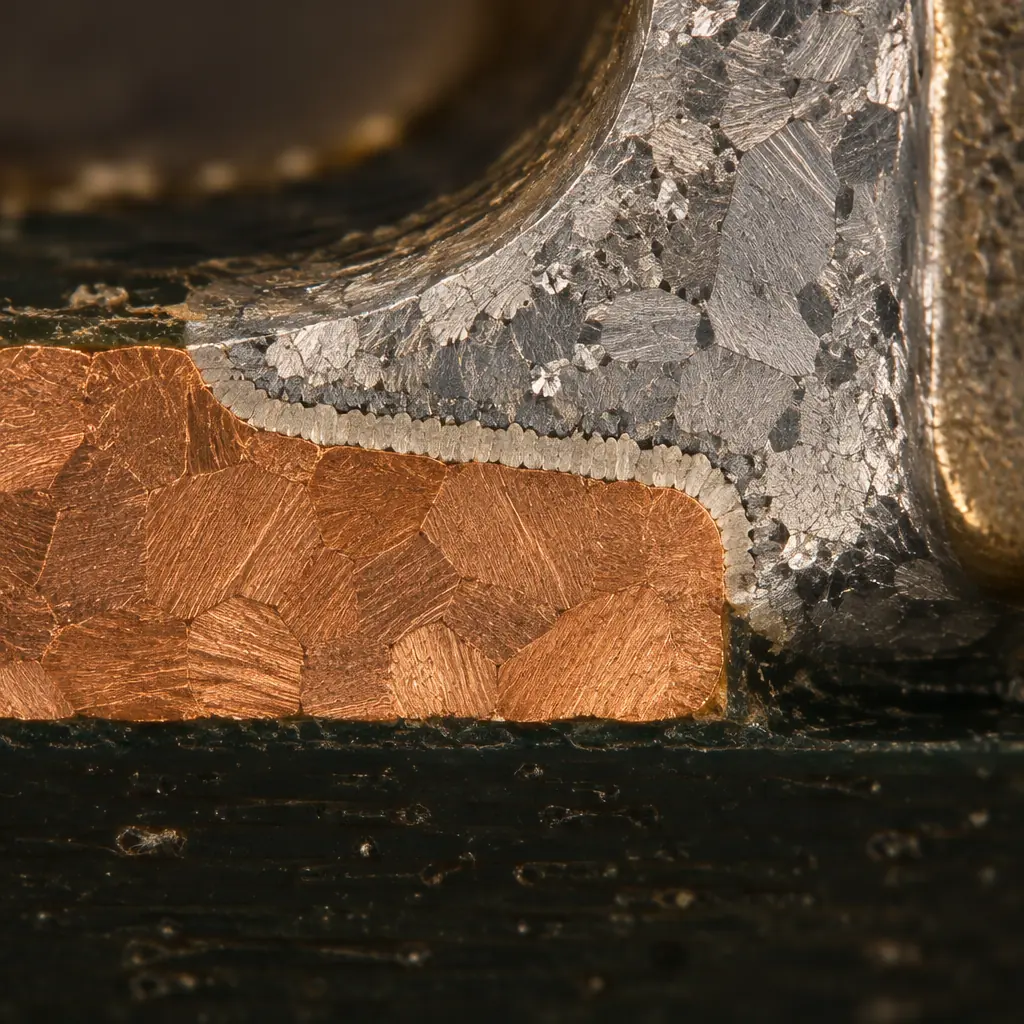
A field return that fails at year three almost never arrives labelled as a metallurgical problem. It arrives as "intermittent open" or "cracked joint", and by the time anyone cuts a cross-section the intermetallic layer at the pad interface is the only evidence left. That layer is not a defect. It is the only reason the joint exists. The defect is its thickness.
Every solder joint forms intermetallic compound (IMC) where the molten alloy meets the copper pad. The layer is what actually bonds solder to copper; without it the joint would simply lift off. But the same layer is brittle, and it keeps growing for the entire service life of the assembly. Between roughly 1 µm and 4 µm the joint is sound. Below it the bond is incomplete. Above it the fracture path moves into the compound and the joint loses the ductility that lets it survive thermal cycling.
This article covers what the two phases are, what thickness a buyer should accept, what makes growth accelerate in production, and how the number is actually obtained from a cross-section. The short answer for procurement is at the end, in PO language.
What the Intermetallic Layer Actually Is
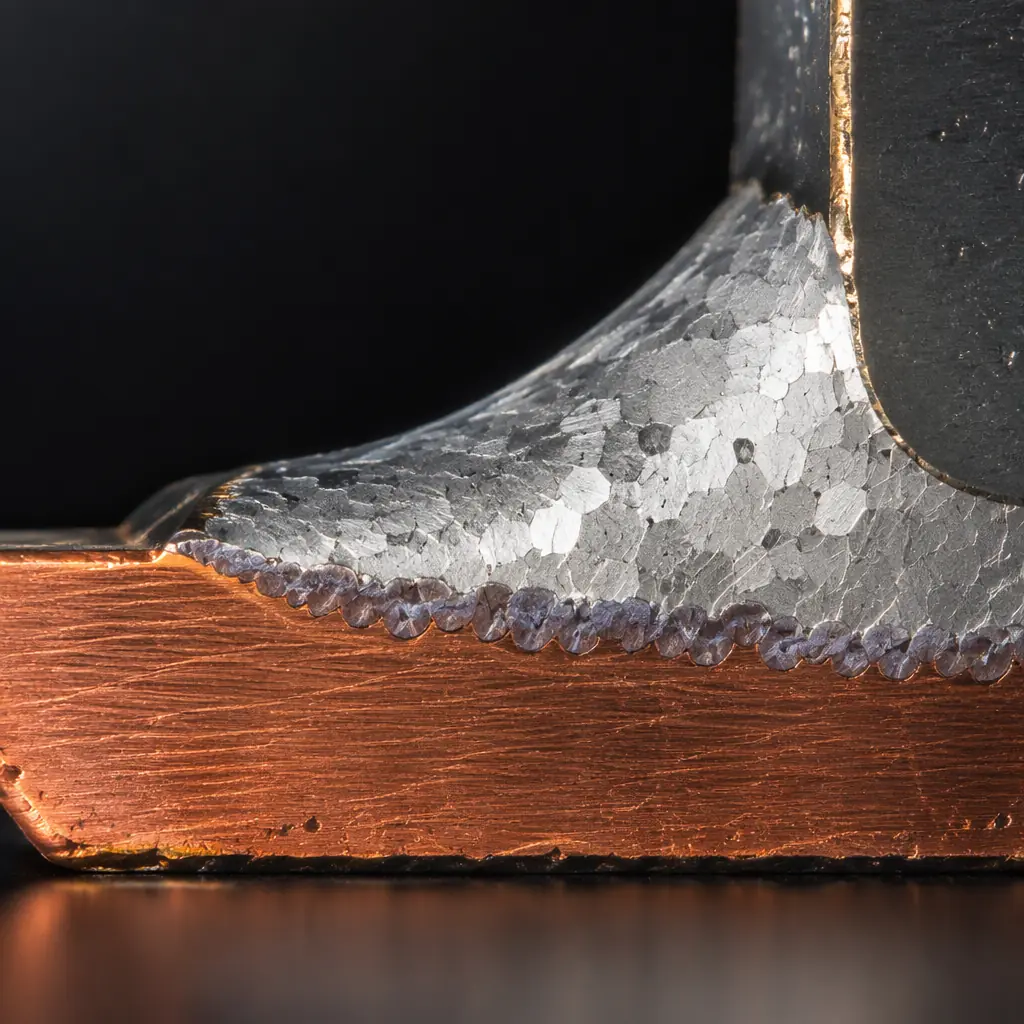
When molten solder wets a copper pad, copper dissolves into the solder and reacts with tin to form a new crystalline compound at the boundary. The reaction is self-limiting in the short term because the growing layer separates the two reactants, but it never stops entirely — it only slows. At room temperature the growth is slow enough to ignore. At 125 °C or during a second reflow pass, it is not.
Cu6Sn5 and Cu3Sn: The Two Phases That Matter
Two distinct compounds appear at a copper–tin interface, and they behave very differently:
| Phase | Where it sits | Character | Growth driver |
|---|---|---|---|
| Cu6Sn5 (eta) | Solder side, adjacent to the solder bulk | Scalloped, relatively ductile, the primary bonding phase | Forms first, during reflow; dominates the measured thickness early |
| Cu3Sn (epsilon) | Copper side, between the pad and Cu6Sn5 | Planar, hard and brittle, the phase that cracks | Grows at the expense of Cu6Sn5 during solid-state ageing |
| Kirkendall voids | Inside or beside the Cu3Sn layer | Void row parallel to the interface | Unequal diffusion rates; appears with thick Cu3Sn |
The practical consequence is that a total IMC measurement alone is misleading. A joint with 3 µm of scalloped Cu6Sn5 is healthier than one with 1 µm of Cu6Sn5 and 2 µm of planar Cu3Sn, even though both read the same on a rough measurement. When you ask a supplier for a cross-section report, ask which phase the number refers to.
Key takeaway: Cu6Sn5 is the bond. Cu3Sn is the ageing product. A report that quotes a single "IMC thickness" without separating them cannot distinguish a sound joint from an aged one.
The Thickness Window: Why Both Ends Fail
The acceptance range used across tin–copper solder joints is roughly 1 to 4 µm total intermetallic, measured perpendicular to the pad surface. The upper end is not a hard standard limit — no clause in IPC-A-610 or J-STD-001 sets a maximum IMC thickness — but it is the point beyond which the mechanical behaviour of the joint changes for the worse in a way that shows up in thermal cycling.
The lower end is a process control issue rather than an ageing one. A layer under about 1 µm means the wetting reaction was incomplete: insufficient time above liquidus, a pad contaminated by oxidation or residue, or a finish that inhibited the reaction. These joints look acceptable optically and pass a pull test immediately after assembly, then fail at the interface in the field because the bond was thin from day one and only gets thinner as the pad side is consumed.
What Accelerates Growth in Production
Growth rate is dominated by temperature and time, and every additional thermal excursion in the process adds both. The four factors below account for most of the variation between two suppliers building the same board.
Time above liquidus, not peak temperature
Peak temperature gets the attention, but the growth integral is driven by how long the joint spends within a few tens of degrees of peak. Extending the time above liquidus from 45 s to 90 s to improve wetting on a large thermal mass roughly doubles the growth contribution of that pass. This is the most common way an otherwise correct profile produces over-thick IMC. See our reflow profiling guide for how to measure the actual plateau rather than the setpoint.
Number of reflow passes and rework cycles
A double-sided assembly sees the joint twice; a reworked joint may see it four times. Each pass adds growth and, more importantly, converts Cu6Sn5 into Cu3Sn. J-STD-001 limits the number of rework cycles precisely because the metallurgy accumulates damage that the visual inspection cannot see. A drawing that specifies a maximum reflow count is asking for this control.
Copper concentration in the solder pot
In wave and selective soldering, copper dissolves into the bath continuously. Once the copper level rises above roughly 0.9–1.0 wt%, the alloy approaches saturation and the intermetallic forms as suspended platelets in the bath instead of at the joint — producing rough, dull joints and a much thicker interface. Bath chemistry analysis on a fixed interval is the control, not visual judgement of the solder wave.
Pad finish and the barrier it provides
Bare copper reacts fastest. ENIG inserts a nickel layer that reacts far more slowly with tin, producing a (Ni,Cu)3Sn4 layer that grows at a fraction of the copper rate — but brings its own failure mode when the nickel is corroded, documented in our article on black pad syndrome in ENIG. OSP has no barrier at all and depends entirely on the copper underneath. Finish choice therefore decides the growth rate before the profile is even set, and should be specified alongside the alloy in solder paste selection.
How Growth Is Measured on a Cross-Section
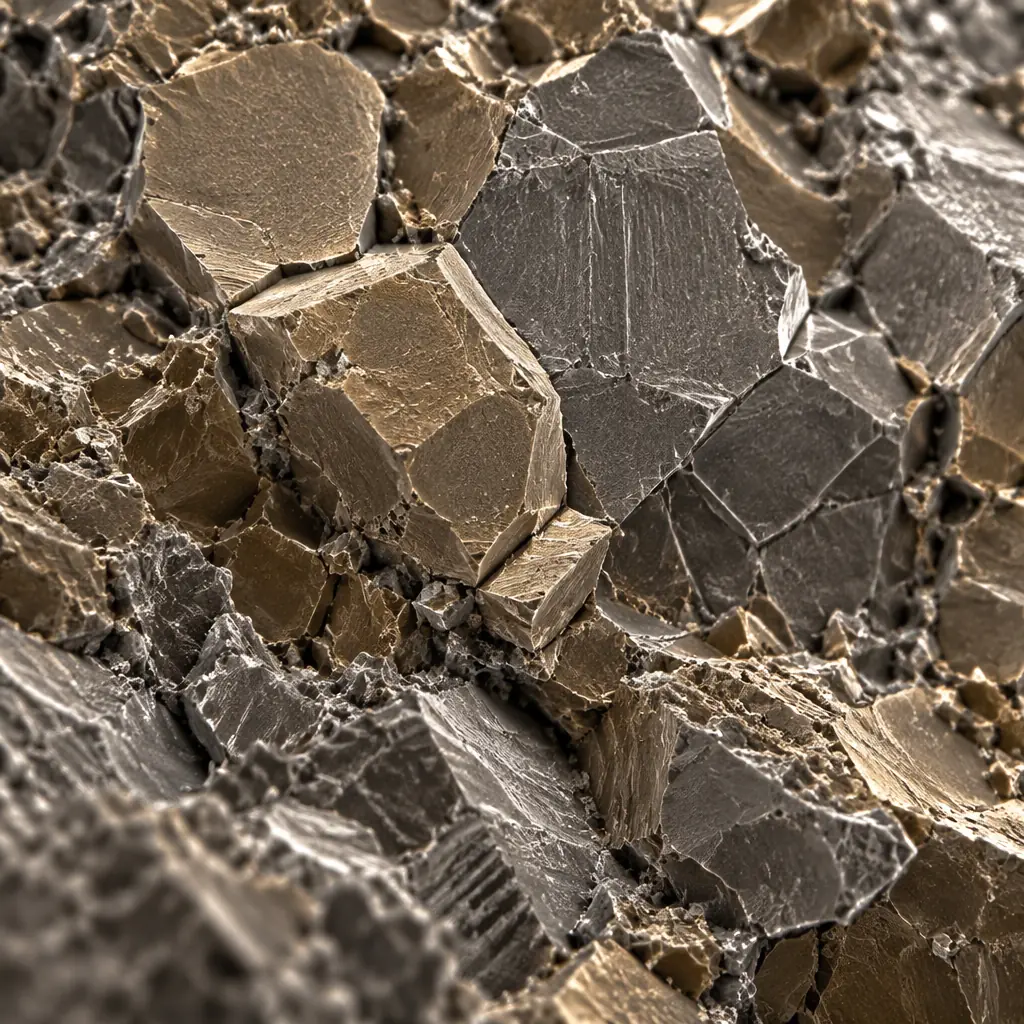
IMC thickness cannot be measured from the outside. It is obtained by sectioning a joint, polishing the cut face to a mirror finish, and imaging the interface at high magnification. The method matters as much as the result, because a careless measurement can be off by a factor of two.
| Step | Requirement | What goes wrong if skipped |
|---|---|---|
| Sectioning plane | Through the joint centre, perpendicular to the pad | An oblique cut inflates apparent thickness by 1/cos of the angle |
| Polishing | Progressive grit to 1 µm or finer, final polish with minimal relief | Differential hardness of copper, IMC and solder causes edge rounding and a false thin reading |
| Etch | Light etch that reveals phase boundaries without attacking them | Over-etch removes the Cu3Sn layer entirely — the phase you most want to see |
| Imaging | SEM at 1,000–3,000x, backscatter preferred for phase contrast | Optical microscopy cannot resolve a 1 µm layer reliably |
| Measurement points | At least 3 points per joint, at least 3 joints per report | A single point on a scalloped interface is not a measurement, it is an anecdote |
Ask for the average and the maximum, not the average alone. The maximum is what governs whether the brittle layer has started to control the fracture path.
Ageing Tests That Predict Field Life
Thickness measured on an as-built joint tells you about the process. Thickness measured after an accelerated ageing test tells you about the decade ahead. Three test regimes are relevant, and they stress the joint differently.
| Test | What it stresses | Typical condition | What it reveals about IMC |
|---|---|---|---|
| Thermal cycling | Differential expansion between pad, joint and laminate | −40 to +125 °C, hundreds of cycles | Whether the brittle layer has become the fracture path — see thermal cycling testing |
| Isothermal ageing (HTOL / bake) | Diffusion, with no mechanical cycling | 125–150 °C for 500–1,000 h | Pure growth kinetics: how fast Cu3Sn thickens and voids appear |
| IST | Z-axis thermal fatigue of the via and joint | Rapid ramp between extremes | Interaction between IMC growth and plated barrel stress, covered in IST vs thermal shock |
A well-built report shows the IMC thickness at time zero and after the ageing interval, for both phases. The delta is the useful number: it is the growth rate, and it can be extrapolated against the activation energy of the specific alloy to estimate what the joint will look like after ten years at the application's service temperature.
Two failure signatures are worth recognising before the report arrives. Head-in-pillow — where the ball never fully coalesced because paste and ball oxidized separately — leaves a distinctive interfacial gap documented in our head-in-pillow analysis. And a void row parallel to the pad is Kirkendall voiding, which means the Cu3Sn layer has already grown thick enough to consume copper faster than it arrives. For void acceptance limits on X-ray, see solder voiding acceptance criteria.
Procurement note: a supplier who can show IMC thickness at time zero and after ageing, split by phase, is running a controlled process. A supplier who quotes a single number with no test attached is quoting a measurement, not a capability.
What to Put in the PO and Drawing
The metallurgy above translates into four clauses that belong in the purchase order or the fabrication drawing. None of them require the buyer to interpret a micrograph — they require the supplier to produce one on request.
Finish and alloy specified together
State the pad finish (ENIG with nickel thickness per IPC-4552, or OSP, or HASL) and the alloy. A finish change without an alloy review changes the growth rate, and the two are usually specified on different documents by different people. Our comparison of ENIG vs HASL covers which finish survives which thermal load, and lead-free vs leaded covers the alloy side of the same decision.
Maximum reflow and rework count
Specify the number of reflow passes the design allows and the maximum rework cycles per joint. This is the single most effective control on cumulative growth, and it is free to add to a drawing.
Cross-section frequency and report content
Require a cross-section report at first article and at a stated interval thereafter — per lot for a new product, per month or per shift for a running program. Specify that the report must state IMC thickness by phase, method, and magnification, so that two suppliers' reports can be compared.
Solder bath chemistry interval for through-hole work
If the assembly includes wave or selective soldering, specify copper concentration limits and the analysis interval. This is the control that prevents bath saturation from becoming a joint defect six months into a program.
Summary
The intermetallic layer is the bond; its thickness is the risk. Between roughly 1 and 4 µm with Cu6Sn5 dominant the joint is sound, and the most reliable way to stay in that window is to control time above liquidus, count reflow passes, keep the solder bath chemistry inside its limit, and match the pad finish to the alloy. The measurement — section, polish, etch, SEM, three points per joint, both phases — is what turns those controls into evidence.
At Huaxing PCBA, cross-section reports on plated joints and solder interfaces are produced in-house at first article and on request for running programs, with IMC thickness reported by phase alongside the imaging method. If you are qualifying a new assembly or auditing a supplier's joint quality, our engineering team can review your drawing's finish and reflow specification against the growth profile your application will actually see — send the stackup and drawing and we will come back with the specific clauses worth adding.