A thermal cycling result travels only as far as the sample it was generated on. We have seen the same 0805 joint family pass 1,000 cycles on a 1.0 mm coated board and crack at 437 on a 1.6 mm uncoated one, with the same alloy and the same oven. A report that says only "passed 1,000 cycles" carries none of the information needed to know which result applies to your product. Both of these builds passed:
| Test | Build A | Build B |
|---|---|---|
| Component | 4-layer, 1.6 mm thick | 4-layer, 1.0 mm thick |
| Via treatment | Through-hole vias, general rule | Through-hole vias, thermal reliefs on power plane |
| Coating | None | Conformal coating over the surface |
| Cycle profile | -40 / +85 °C, 10 min dwell | -40 / +125 °C, 10 min dwell |
| Result | Failed at 437 cycles | Passed 1,000 cycles |
Neither number predicts the field life of your product. The first build failed early because a thinner board with a different via construction performs differently, so the result says nothing about the 1.6 mm stackup. The second passed because the test was gentle relative to the risk: a 1.0 mm board with reliefs and coating is close to a well-designed net, and -40/+125 does not stress a conformal coating beyond its linear range.
Four variables decide whether a thermal cycling result means anything: the profile, the number of cycles, the boundary the part sits on, and the construction of the sample. Get all four on the report and the number becomes usable. Miss one and the reader is guessing.
Variable 1: The Profile, Which Is Really a Delta and a Dwell
A thermal cycling profile has three parts that matter and one that mostly does not.
- Delta T. The temperature difference between the extremes drives the strain, and it is close to linear with the number of cycles to failure for a solder joint. Moving from -40/+85 (125 K delta) to -40/+125 (165 K delta) is a 32% larger excursion, and it will shorten life by far more than 32%.
- Dwell time at the extremes. Dwell is not decoration. A 10-minute dwell lets a thick board reach the chamber air temperature; a 5-minute dwell on a 2.0 mm board with a heavy copper plane does not. The sample sees less delta than the controller reports.
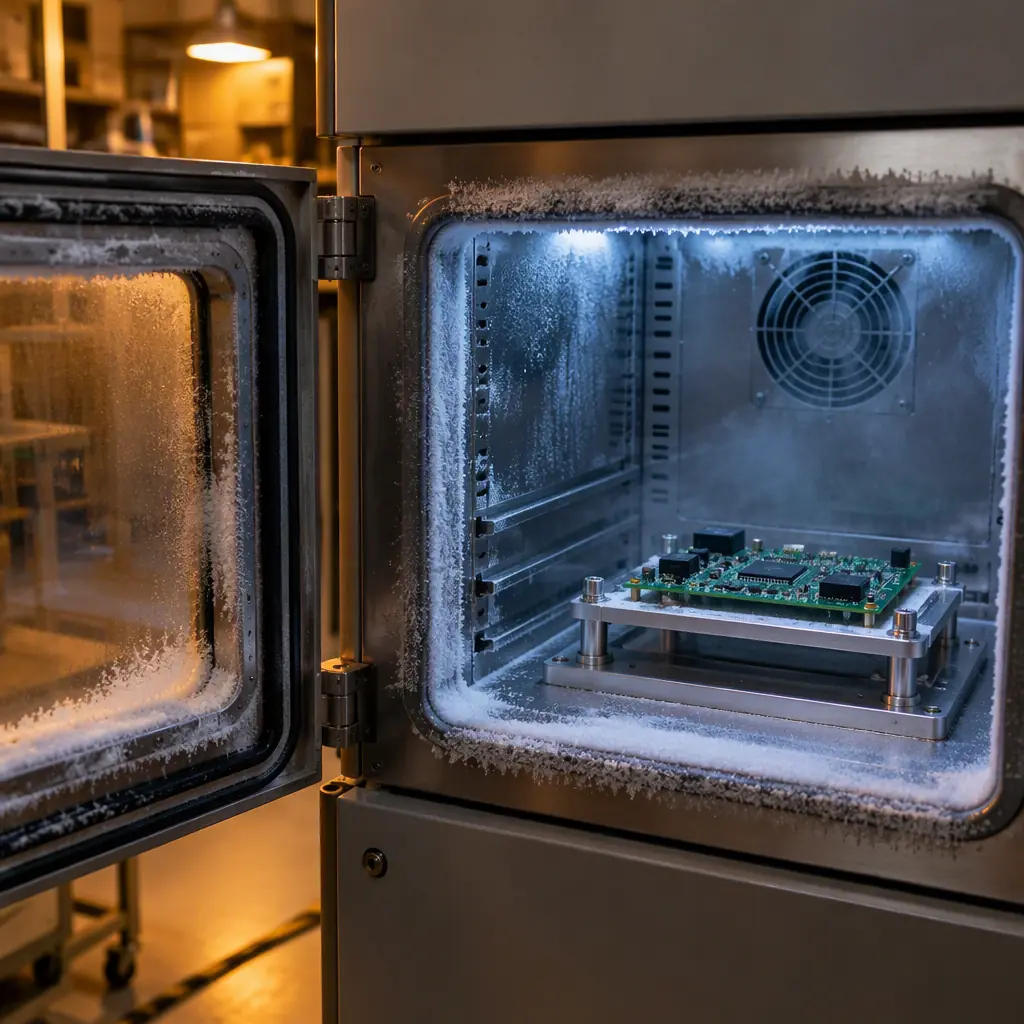
- Ramp rate. Higher ramp rates increase the through-thickness gradient, which matters most for thick assemblies and large chip components. IPC-9701-aligned cycles typically run 10 to 15 K/min; anything above about 20 K/min stresses the part differently from the field.
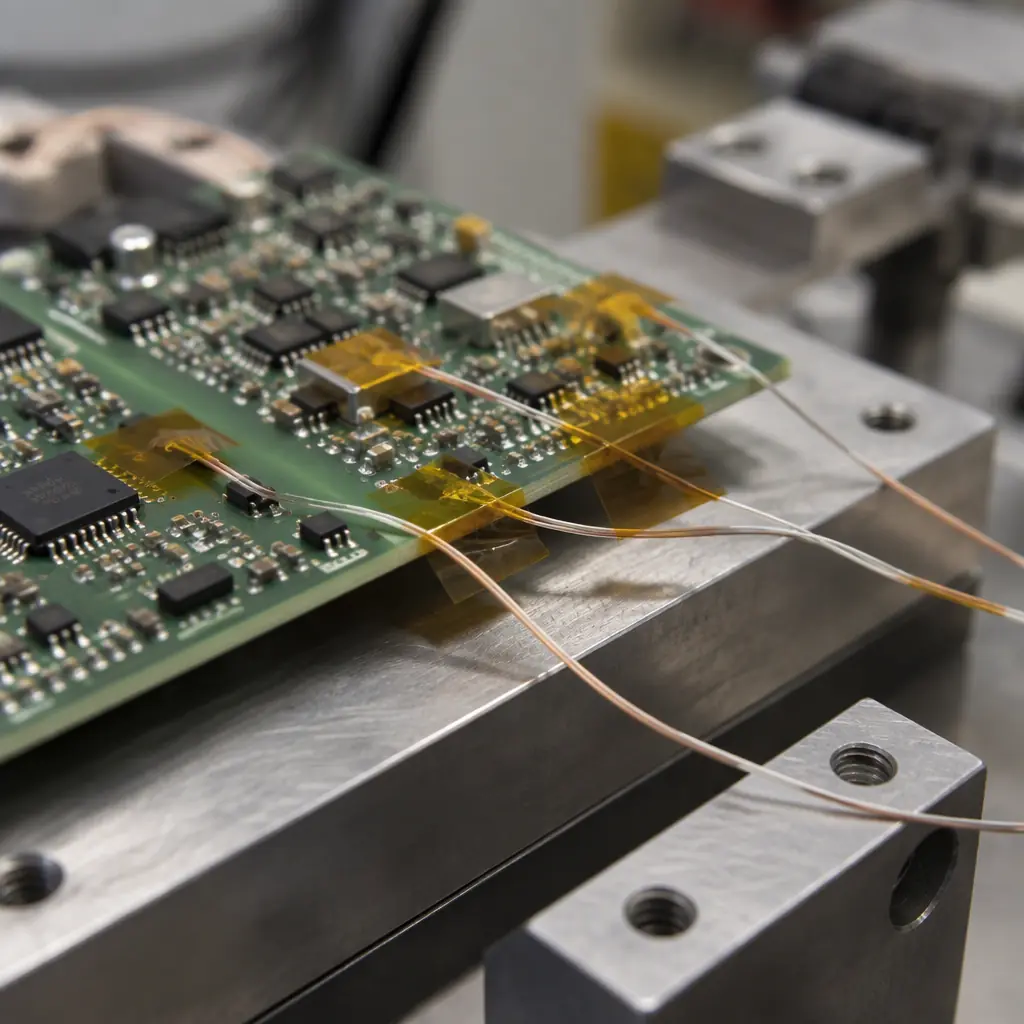
- What mostly does not matter: the exact chamber model, as long as the profile is verified by a thermocouple attached to a real assembly rather than read off the chamber display.
Ask for the profile curve with a thermocouple trace, not just the pass criteria. If the trace comes from a bare coupon rather than a populated board, the delta on the actual parts is unknown.
Variable 2: Cycle Count, and the Weibull Behind It
The number of cycles is only meaningful together with the failure distribution. A 1,000-cycle pass on a sample of 3 units means something different from a 1,000-cycle pass on 20 units, and both mean something different from a Weibull fit that shows 63.2% failed at 1,400 cycles with 8 units failed and 4 suspended.
Three statistics belong on a qualification report:
- Sample size and how many failed or suspended. "12 tested, 0 failed, 12 still running at 1,000" is a censored result, and the correct answer is a lower confidence bound on life, not a pass mark.
- Characteristic life and shape parameter where a fit is possible. Slope below about 2 suggests wear-out is not the dominant mechanism and that the sample may be dominated by early-life defects rather than the physics you meant to test.
- Acceleration factor and its basis. If the supplier extrapolates 1,000 test cycles to 10 years of field life, ask for the Arrhenius or Coffin-Manson factor used and the activation energy assumed. A factor quoted without a basis is a guess with significant digits.
A useful reference point for buyers: an electronics build claiming 10-year life in a -40/+85 environment typically needs a test that reaches at least 1,000 cycles with documented acceleration logic. Anything shorter is a screen, not a qualification.
What Each Test Method Costs and What It Returns
Thermal cycling is one option in a family, and buyers rarely see the trade-offs side by side. The table below is the comparison we use in test-plan discussions, with typical Shenzhen lab turnaround rather than best-case marketing numbers.
| Method | Typical duration | Indicative cost per build | What it returns |
|---|---|---|---|
| Thermal cycling, air-to-air, -40/+125 | 500 cycles in 10-14 days | USD 800-1,800 | Solder joint and barrel fatigue, with in-situ monitoring |
| Thermal shock, liquid-to-liquid | 300-500 cycles in 5-8 days | USD 900-2,000 | Faster, harsher; sharper on interfacial failure, less field-representative |
| IST (interconnect stress test) | 1,000 cycles in 3-5 days | USD 500-1,200 | Via and PTH integrity on a dedicated coupon, fast ranking between constructions |
| THB or HAST with bias | 500-1,000 hours in 4-6 weeks | USD 1,200-2,500 | CAF, electrochemical migration, insulation resistance decay |
| Isothermal storage, tin whisker | 3,000-4,000 hours in 5-6 months | USD 600-1,500 | Whisker growth on matte tin and lead-free finishes |
| Random vibration plus cycling | Combined, 3-4 weeks | USD 2,000-5,000 | Combined environment for transport and mobile use |
The practical reading: IST is the cheapest way to rank two stackup options, thermal cycling is the cheapest way to qualify a finished assembly, and humidity work is the one most often skipped and most often the actual field failure mode in coastal or washing environments. A test plan that spends everything on cycling and nothing on bias testing has optimised for the easier test.
Variable 3: The Boundary — What the Part Is Actually Attached To
This is where most test-plan reviews fail. The qualification is run on a test board the supplier prefers, not on the boundary the product uses.
Solder joints fail on the difference in coefficient of thermal expansion between the component and the board, multiplied by the temperature excursion and divided by the standoff geometry. Change any of those and the result changes:
- Board material. A high-Tg FR-4 with a low in-plane CTE behaves differently from a standard Tg 130 laminate. A qualification on standard FR-4 does not transfer to a high-Tg build with heavy copper.
- Via construction. Filled and capped vias change the local stiffness around a BGA pad. A pass on unfilled vias is not evidence for via-in-pad.
- Component mix. A 15 mm body component with a low standoff experiences much higher shear strain than a 0603. If the qualification board has none of the large components, the hardest joints were never tested.
- Coating and underfill. Coating adds a mechanical constraint and can help or hurt; underfill redistributes strain and must be in the test if it is in the product.
The question that exposes the gap is simple: "was the qualification sample built to the same construction as the production part, including coating and underfill, and if not, which difference did you assess?" Suppliers who have thought about it answer in one sentence. Suppliers who have not answer with a document number.
Variable 4: Which Failure Mode the Test Can Actually Catch
Thermal cycling catches a specific set of mechanisms: solder joint fatigue, plated through-hole barrel cracking, microvia interfacial failure and delamination driven by CTE mismatch. It does not catch others, and buyers routinely accept it as a substitute for each of them.
| Mechanism | Caught by thermal cycling? | Test that actually catches it |
|---|---|---|
| Solder joint fatigue | Yes, primary mode | Thermal cycling with in-situ resistance monitoring |
| PTH barrel cracking | Yes, on thick boards and high aspect ratio | Thermal cycling plus microsection after test |
| Microvia interfacial failure | Partly, needs IST or high-cycle count | IST, or thermal cycling to 1,000+ cycles |
| CAF growth | No | THB or HAST with bias, plus insulation resistance monitoring |
| Electrochemical migration | No | THB / HAST with bias, ionic cleanliness verification |
| Tin whisker growth | No | Isothermal storage at 50-55 °C plus humidity, per JESD22-A121 |
| Component moisture damage (popcorning) | No | MSL preconditioning per J-STD-020 before reflow |
The most common mismatch we see is a product with a high-impedance analog section qualified with thermal cycling alone. Cycling will not find a 10 MOhm leakage path caused by flux residue under a coating; a biased humidity test will, in a few hundred hours.
Building a Test Plan From the Product Environment Instead of From a Template
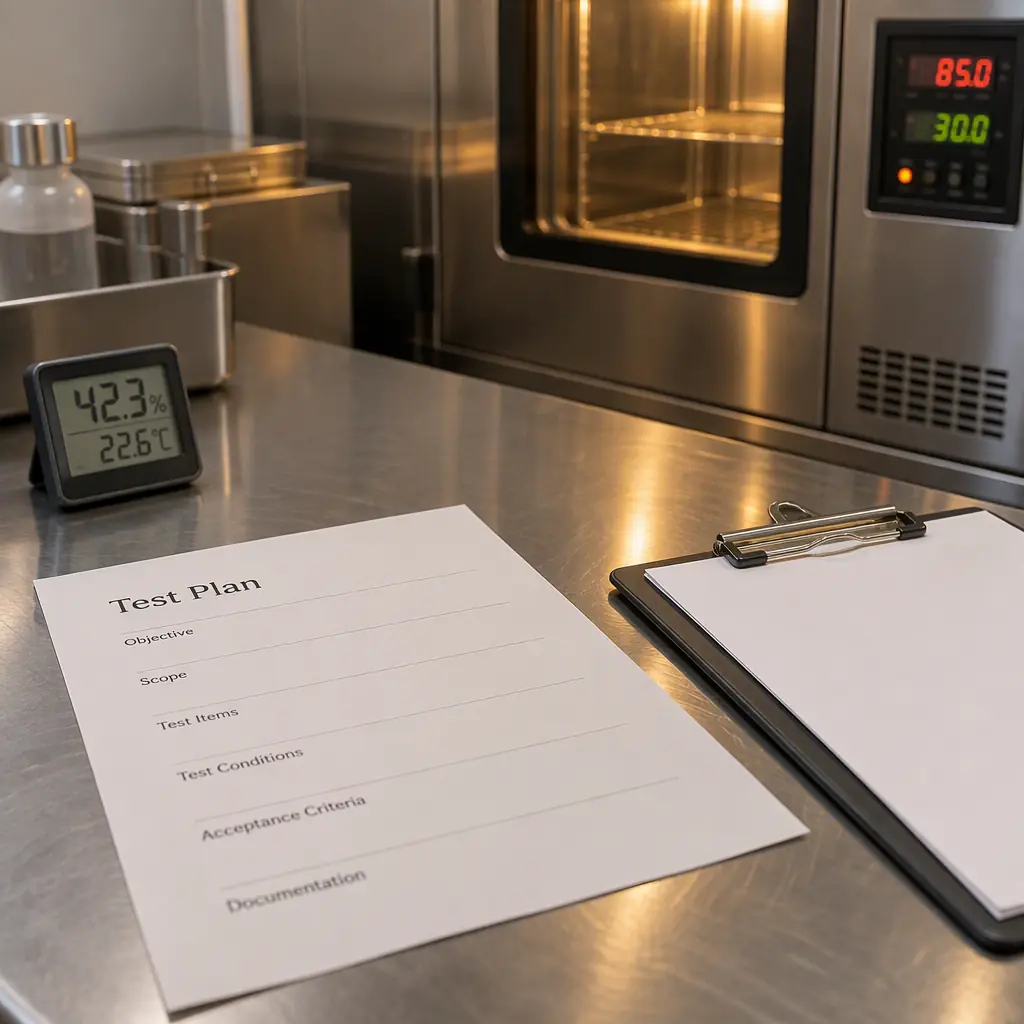
The order of work should be: environment, then mechanisms, then methods, then sample, then acceptance threshold. Most plans are built in reverse, starting from a test the supplier already owns.
Step one: write down the actual environment with numbers. "Industrial" is not an environment. A temperature range with a duty cycle, an annual number of excursions, a humidity band, a vibration source and an expected service life in years is an environment. For a control board inside a sealed cabinet in northern Europe, the range may be -20/+70 with 500 cooling excursions a year. For a board in an unsealed roadside cabinet, it may be -30/+85 with condensation cycles, which changes the test list entirely.
Step two: pick the mechanisms that the environment can drive, using the mechanism table further down. Condensation points at bias humidity testing. Wide thermal excursions point at cycling. Coastal humidity points at CAF and ionic cleanliness. High-vibration mounting points at combined vibration.
Step three: choose the method that catches the mechanism at the lowest cost, and state the acceptance threshold before the test runs. A threshold chosen after seeing the data is not a criterion, it is a negotiation.
Step four: define the sample so the result transfers. That means at least one sample built to the production construction including coating and underfill, and at least one sample containing the largest and heaviest components in the BOM. Ten small boards and no large components tests the easy joints.
One planning discipline is worth adopting from aerospace practice even for industrial products: write the test report's summary page before the test. If the page cannot be written because a number is missing, the plan has a gap that can still be fixed for free.
Reading the Report: Six Items to Demand Before Sign-Off
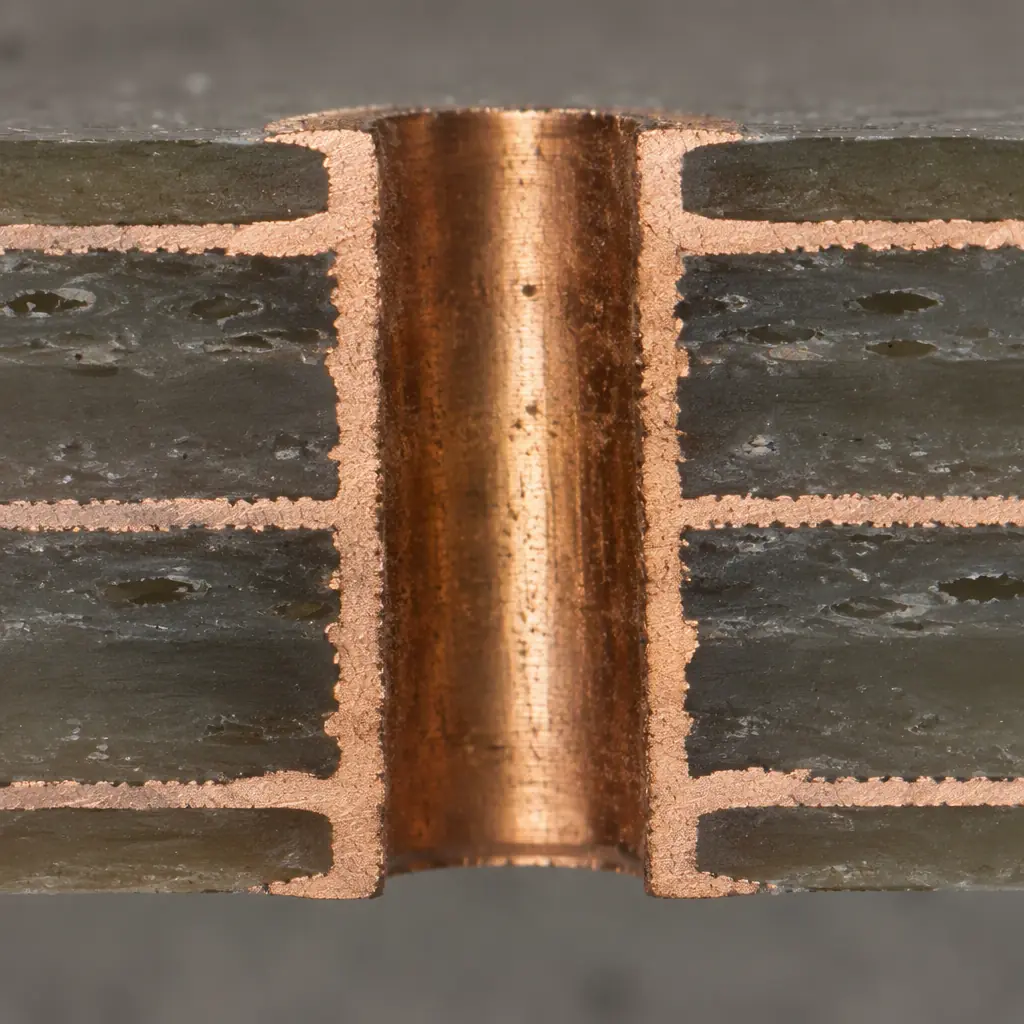
- Profile curve with a thermocouple trace on a populated sample, plus the delta T actually achieved.
- Sample size, failures, suspensions and whether the test was truncated.
- Sample construction, stated as a difference list against the production part rather than a reference to a test board part number.
- In-situ monitoring method and threshold, for example continuous resistance monitoring with a failure threshold of +20% or 1,000 Ohms, sampled no slower than every few seconds. End-point testing only is a much weaker result and should be labelled as such.
- Failure analysis evidence for anything that did fail, with a microsection rather than an assertion. Where the failure analysis is supplied, it should name the mechanism, not just the location.
- An explicit statement of what the test does not cover, matched against the product's actual environment.
If those six items are on the page, a qualification report is a decision tool. Without them it is a marketing document with a cycle count attached, and the buyer's only remaining option is to re-test, which is the most expensive way to learn what the supplier already knew.
Our own thermal cycling runs at -40/+125 with 10-minute dwells per IPC-9701-aligned practice, with continuous in-situ resistance monitoring, and failure analysis by microsection is included on any failing unit rather than sold as an extra. Where a product's risk is humidity or bias driven, we say so and add THB or HAST rather than letting thermal cycling stand in for it.