
Most defect reports from an assembly house contain a mechanism and stop there: "insufficient solder due to poor wetting". That is a description, not a finding. It cannot be verified, it cannot be repeated, and it usually leads to a corrective action aimed at the wrong process step.
The structured alternative is older than SMT and still under-used: define the problem as an is and an is not, then design the smallest measurement that discriminates between the surviving candidates. It typically costs 2 to 5 working days and a few hundred dollars of lab time, and it converts an argument into a test plan. This is the method we apply to field returns and to recurring internal defects.
The Is / Is Not Frame, Applied to a Real Board
Start with the observation, then force it into six dimensions. Nothing here requires a lab. It requires someone to walk a line and look.
| Dimension | Is | Is not | What the contrast suggests |
|---|---|---|---|
| What (object) | 0805 resistor R44 and R45, one pad each | All other 0805s on the same board | Not a generic paste or reflow problem |
| Where (location) | North pad only; the pad adjacent to the board edge | South pad, interior pads | Directional: heat shadow, paste deposit, or pad geometry |
| When (time) | Since lot 24-0912, both shifts | Lots before 24-0877 | A change, not a drift |
| Who / which line | Line 3, both operators | Line 1 running the same product | Tooling or program, not person |
| How much (extent) | 9 of 240 boards, all in one panel position | Other panel positions on the same panel | Panel-level or stencil-level, not machine-wide |
| Trend | Constant rate within the lot | Increasing over the run | Setup-linked rather than consumable-linked |
Read the last column as a scoreboard. Each "is not" eliminates whole families of cause. A defect that appears in one panel position only, on one line only, since a specific date, is not going to be explained by paste batch or by operator skill. Three candidate families survive: stencil condition at that position, pallet support at that position, or a panel design change.
From the Contrast to Three Candidate Causes
Only now bring in the defect model. The mechanism matters, but it should be selected after the contrasts, not before. Three failure mechanisms cover most solder-joint findings, and each predicts a different set of "is/is not" entries.
Thermal imbalance. One pad heats faster than the other, so the joint in contact with the cooler pad solidifies first and pulls the component upright, or in milder cases simply leaves a weak fillet. The prediction: the defect is directional, correlates with copper distribution and with component orientation in the oven, and moves if the board is rotated 90°.
Paste deposit deficit. One aperture releases less than the nominal volume because of area ratio, blocked aperture, or stencil tension loss. The prediction: the defect is position-locked on the panel, unchanged by oven rotation, and visible in SPI data at that aperture if SPI covers it.
War page and support. At reflow temperature a panel bows, and a component sitting over a support gap never makes contact with paste. The prediction: the defect is at a fixed distance from the panel centre or edge, appears at one panel position, and disappears when the carrier or support is changed.
For the board in the table, all three survive the first pass. The measurement budget should therefore be spent on the cheapest one that eliminates the most candidates, which is almost always the oven rotation test: move the panel 90° in the oven and run 30 boards. If the defect follows the board edge, it is thermal or support; if it follows the pad, it is paste or design.
Where the Frame Usually Breaks: Underspecified "Is" Entries
The method fails in practice for one reason: the "is" column is written at a level of abstraction that cannot be checked. "Solder defect on 0805s" is not an observation, because the next person to look will count differently and the numbers will shift. Four rules keep the observation tight.
- Name the pad, not the part. "R44 north pad" is checkable. "R44" invites a debate about whether the south joint is also marginal.
- Quantify against a denominator. Nine boards is meaningless without the lot size, the panels inspected and the sampling rule. "9 of 240 boards, all panels inspected by AOI with 30% X-ray" is an observation.
- State the defect against a criterion, not an impression. "Fillet height below 25% of the pad width" is measurable and mappable to IPC-A-610. "Poor fillet" is not.
- Give the "is not" equal precision. "All other 0805s on the same board, 231 of 231 joints" is far more informative than "nothing else".
In a recent internal case, the first pass produced an "is" of "solder defect on 0805 resistors near the board edge" and a corresponding "is not" of "everything else". The numbers moved by 40% between two inspectors. After rewriting the entries to name pads and to count against inspected joints, the contrast sharpened to a single pad on a single panel position, and the candidate list fell from six to three before any lab time was spent.
Defect Localisation by Cross-Section, X-Ray or Both
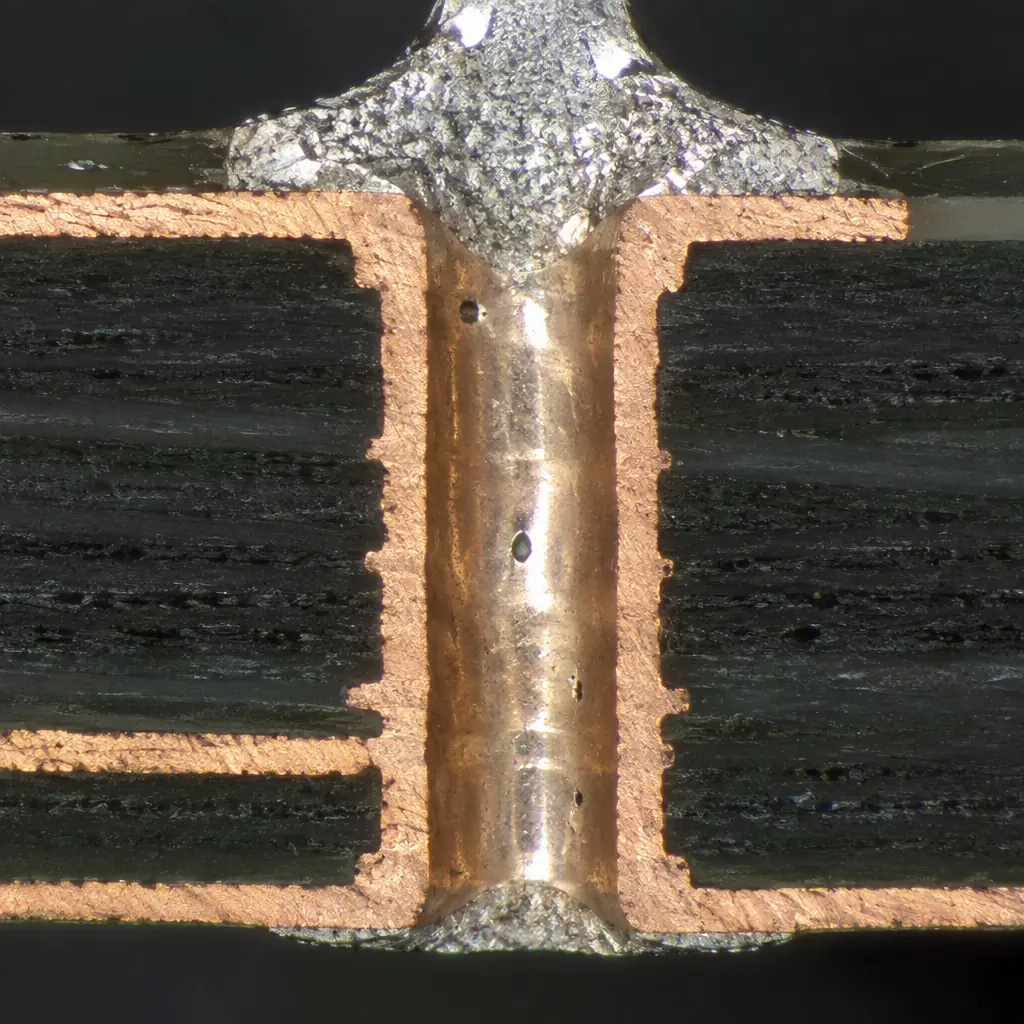
Non-destructive first. X-ray answers "is there a void or a gap", and it is quick. It does not answer "which interface failed" for a joint that looks continuous. Cross-section answers the interface question and costs a board plus a few hours.
- X-ray before sectioning so you know where to cut. Sectioning on a guess wastes a board and a day.
- Section through the joint, not beside it. A polish that lands 0.2 mm off the axis shows the fillet and not the interface, which is where the evidence is.
- Record the etch and the magnification. A "cold joint" claim supported by a photograph at 20x without an etch is not evidence of intermetallic condition.
- Keep the specimen. Photograph it, bag it, label it with the panel position and lot. The second question always arrives a week later.
A useful rule on cost: a full external lab analysis with SEM and EDS on a single joint runs in the few-hundred-dollar range and 5 to 10 working days. A sectioned joint under an optical microscope in-house is roughly an hour of technician time and answers 70% of interface questions. Escalate to SEM and EDS only when the question is about intermetallic composition or contamination, not about geometry.
Designing the Discriminating Experiment
The output of the is/is not frame should be a short list of experiments, each with a stated prediction. If an experiment's outcome cannot eliminate a candidate, it is not worth running.
| Experiment | Cost / time | If defect follows the board | If defect follows the pad |
|---|---|---|---|
| Rotate panel 90° in the oven, 30 boards | 2 boards scrap, 4 hours | Thermal or support mechanism | Paste or design mechanism |
| Swap stencil, same design and lot | 1 stencil, 1 day | No change | Stencil or aperture related |
| SPI review of the specific aperture, 200 boards | Data only, 2 hours | Volume in spec | Deposit deficit confirmed |
| Change pallet support at that position | 1 carrier, 1 day | No change | Support-related warp confirmed |
| Add thermal relief or adjust pad geometry (design) | Requires revision | No effect | Confirms design contribution |
Note the ordering: the two cheapest experiments that each eliminate half the candidates come first. Design changes come last, because a design change is the most expensive way to test a hypothesis and the most likely to be adopted before the cause is confirmed.
The Cost of Getting It Wrong, in Numbers
An unverified mechanism is not a neutral placeholder. It triggers corrective action, and corrective action has a price on both sides.
| Wrong conclusion | Typical corrective action taken | Cost consequence |
|---|---|---|
| Blames paste or printing | Paste batch change, printer audit, tighter SPI limits | Paste scrap and slower line for weeks; defect returns because cause remains |
| Blames the operator | Retraining, second-person verification | Labour cost rises permanently; defect continues on both shifts |
| Blames the design too early | Revision, new stencil, requalification | Tooling and NPI cost, 2-4 week schedule impact, possible waiver of a sound design |
| Blames incoming material | Supplier claim, 100% incoming inspection | Inspection labour at every lot, supplier relationship damaged on thin evidence |
Each of those actions is legitimate once the mechanism is verified. Taken on a hunch, each one costs money and leaves the real cause in place, which is why the same defect tends to reappear two or three quarters later under a different report number.

There is a second-order cost that buyers feel more directly: schedule. An unverified finding typically adds one round of sample build, one lot of retest and one customer approval cycle. Across a medical or automotive programme that is commonly four to six weeks, which is usually more expensive than the entire analysis would have been.
Writing the Finding So It Survives an Audit
A finding that holds up to a customer audit or a notified body review has five parts, and they are the same five a good 8D demands:
- The problem statement with quantity and location, expressed so that a reader can find it: 9 of 240 boards, R44 north pad, panel position 4.
- The verified mechanism, with the evidence attached: cross-section number, magnification, the interface named. Not "poor wetting" but "insufficient fillet on the component side, no intermetallic at the pad interface on 6 of 6 sectioned joints".
- The eliminated candidates and why. This is the part most reports omit and the part that prevents the same investigation being repeated next quarter.
- The corrective action with a verification metric, for example "paste volume at that aperture raised from 62% to 95% of nominal by stencil thickness change, verified across 500 boards with SPI Cpk above 1.33 and zero repeats".
- The escape point, meaning how the defect reached the customer if it did, and what gate now catches it.
For a supplier, part three is also the commercial argument. A defect report that names the eliminated causes and the mechanism can be debated on evidence. A report that asserts a mechanism invites a re-investigation, and re-investigation is charged to the relationship even when it is not charged to the invoice.
A Worked Sequence: Nine Hours From Report to Verified Cause
To make the method concrete, here is the elapsed sequence on a real internal escalation for a directional 0805 fillet deficit on a 4-layer control board, with the hours it actually took:
- Hour 0-2: build the is/is not table with the AOI manager and the line engineer in the same room. Confirms one pad direction, one panel position, one lot range, both shifts.
- Hour 2-4: pull SPI data for the specific aperture across the affected lot. Volume at that aperture reads 68 to 74% of nominal while the neighbouring aperture reads 96 to 102%. The paste mechanism is now live and the operator hypothesis is dead.
- Hour 4-6: inspect the stencil at that aperture under magnification. Two apertures show partial blockage from a dried paste ridge and visible tension loss at the frame corner nearest the panel position.
- Hour 6-8: run the swap experiment on 30 boards with a replacement stencil. Zero repeats. The paste mechanism is now verified, not proposed.
- Hour 8-9: write the finding with the eliminated candidates, the corrective action (stencil cleaning interval reduced from 12 to 8 prints at that aperture density, plus tension check added to the changeover checklist) and the verification metric (SPI Cpk above 1.33 at that aperture across 500 boards).
Total cost: one stencil and nine hours. The counterfactual, a paste batch change plus a printer audit plus operator retraining, would have consumed about two and a half weeks of line time and produced no change in the defect rate, because the stencil was always the cause. That comparison is the entire argument for the frame.
What We Hand Over
On an escalated defect, our default package is the is/is not table, the X-ray images, the cross-section photographs with magnification and etch noted, and a statement of which candidates were eliminated. Where the finding points at the design, we say that too, with the alternative design rule and its cost implication, rather than leaving the customer to discover it at the next prototype cycle. Related guides below cover the 8D and CAPA format, the analytical instruments involved, and the DOE side of confirming a fix.