
Every contract manufacturer publishes a first pass yield. Almost none publishes the definition behind it, and the definition is what decides whether two numbers can be compared at all. A plant that counts panels can show several points more yield than a plant that counts individual boards from the same process, without improving anything. A plant that counts a board as passing after a cosmetic rework will beat a plant that counts it as a failure twice, on the identical line.
At Huaxing PCBA we state 98.7% first pass yield in our quality documentation. This page is the accounting for that number: what unit enters the denominator, what event counts as a failure, what is excluded and why, and how a buyer can verify the arithmetic from the supplier's own test logs rather than trusting the headline.
What First Pass Yield Actually Measures
First pass yield is the share of units that pass all specified tests on the first attempt, with no rework, touch-up, or retest, divided by the units that entered test. It is a process metric, not a product metric: it says how often the line gets it right without human intervention, which is the part of quality that predicts future escapes.
| Metric | Numerator | Answers | Typical range, mixed SMT |
|---|---|---|---|
| FPY (first pass yield) | Units passing all tests, first attempt, no rework | How often the process is right first time | 96 to 99.5% |
| Final yield | Units passing after rework and retest | How many ship | 1 to 3 points above FPY |
| RTY (rolled throughput yield) | Product of FPY at every stage | Compounding effect of 6 to 10 stages | 4 to 12 points below FPY |
| DPPM | Defects per million opportunities, at customer | What escapes | 50 to 2,000 |
The gap between FPY and final yield is the rework burden. That gap is why the two numbers should always be quoted together: a line at 98.7% FPY and 99.6% final yield is doing 0.9% rework, roughly 9,000 units per million, each one handled, re-inspected, and re-tested. The rework itself is where a large share of latent defects originate, because a hand-soldered joint is not a reflow joint.
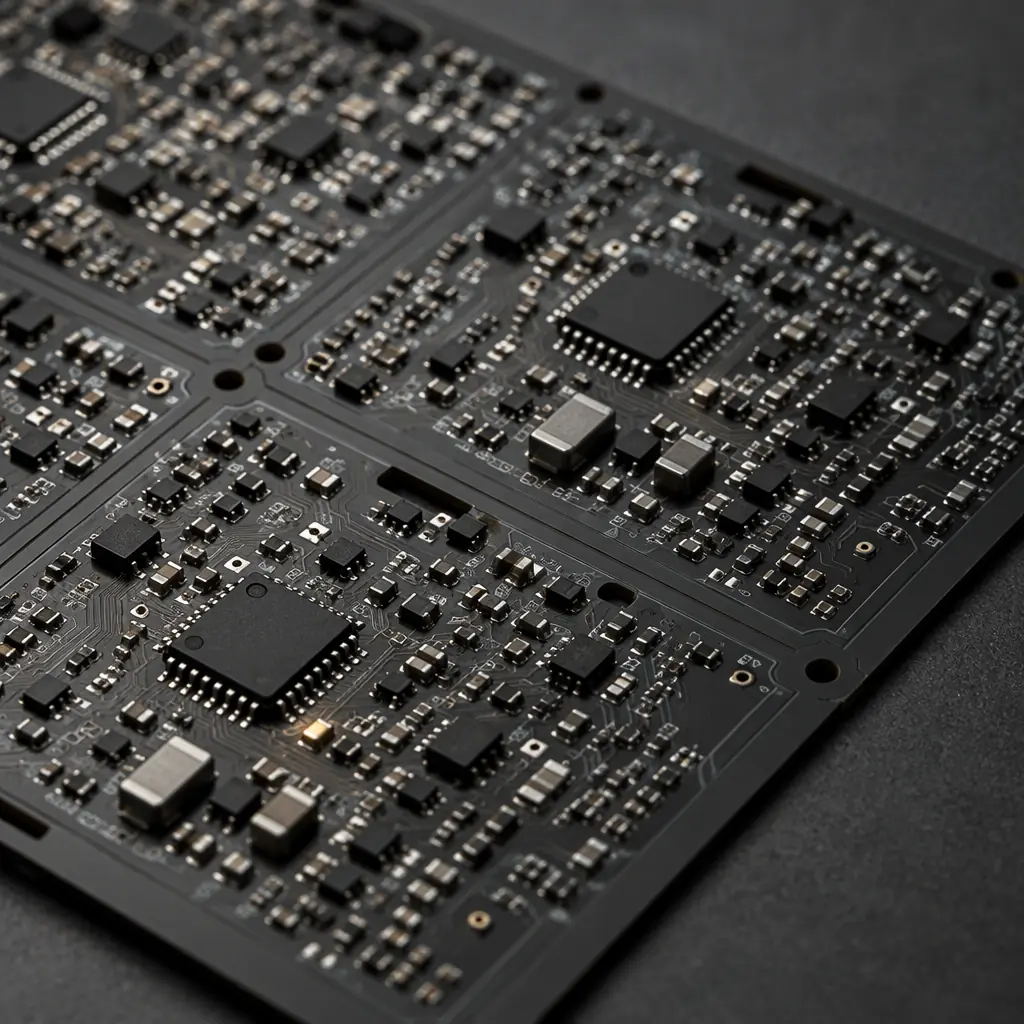
The Four Definitions That Change the Number
Two plants can both report 98.7% and be describing different things. Before comparing, pin down four choices.
Panel or board
A panel carrying 4 boards that produces 1 failure is either a 75% panel yield or a 75% board yield, depending on whether the pass criteria are applied to the panel or to each board. Board-level counting is harsher and more meaningful to a customer, because the customer receives boards. Ask which one the number uses, and whether depanelization damage is counted in it.
X-out handling
If a panel is marked with known-good-unit X-outs and only the good units are tested, the failed boards vanish from the denominator entirely. This can add 2 to 5 points to a reported yield on dense boards. The defensible practice is to count every board built, including those depanelized out before test, and to report X-out separately. Our handling of that case is described in X-out panels and known-good-unit handling.
Cosmetic versus functional failure
A solder ball below the IPC-A-610 limit for the class is a defect. If it is cleaned off and the board ships without being counted as a first-pass failure, the reported FPY measures electrical function only and silently excludes a whole defect family. Confirm which IPC class the count is judged against, because Class 3 rejects things Class 2 accepts and that alone moves yield by more than a point on fine-pitch assemblies.
Customer-supplied and consigned material
When the customer supplies components, a failure caused by a counterfeit or damaged reel is still a failure of the board. Some suppliers exclude those units from FPY because the fault is not theirs. That exclusion is reasonable for accountability but should be reported as a separate line, not folded into a headline number. For how the incoming material gate works, see the supplier quality scorecard.
Where the Missing 1.3% Actually Goes
On a mature mixed-technology line, the non-first-pass units are not randomly spread. They concentrate in four buckets, and each has a different owner. The split below is representative of a 98.7% line running 0201 passives, 0.4 mm pitch QFNs and 0.8 mm pitch BGAs at moderate mix:
| Bucket | Share of the 1.3% | Typical defect signature | Owner of the fix |
|---|---|---|---|
| Print-related | ~40% (0.52 pts) | Insufficient deposit, bridging, slumping after pause | Process engineering, stencil and paste |
| Placement-related | ~15% (0.20 pts) | Offset beyond 25% of pad, tombstone on 0402, wrong rotation | Process engineering, feeder and nozzle |
| Reflow and materials | ~25% (0.33 pts) | Voids over 25%, head-in-pillow, warpage-driven open | Process engineering plus component supplier |
| Test and false failure | ~20% (0.26 pts) | Probe contact resistance, fixture wear, programming error | Test engineering |
Two consequences follow. First, roughly a fifth of a typical first-pass loss is not a manufacturing defect at all, it is measurement error, which means investing in test engineering can move FPY faster than investing in the printer. Second, the customer-supplied-material bucket, when it exists, usually sits outside this split because it is tracked as a separate incoming-quality line. The full arithmetic of a yield loss cascade, including how false calls inflate the loss, is worked through in the FPY denominator audit.
What a Realistic Number Looks Like by Product Mix
Yield is a function of mix, not of skill alone. A plant quoting the same number for a 0402 discrete board and a 0.35 mm pitch CSP board is either not measuring properly or not quoting honestly. These are the bands we quote and hold ourselves to:
| Product profile | FPY band | Dominant loss driver |
|---|---|---|
| Through-hole and coarse SMT, 0603 and above | 99.2 to 99.7% | Placement and hand assembly |
| Mixed SMT, 0402 to 0201, QFP 0.5 mm | 98.0 to 99.2% | Print volume, tombstoning |
| Fine pitch, 0.4 mm QFN, 0.8 mm BGA | 97.0 to 98.8% | Paste release, voids, warpage |
| Large-body BGA over 35 mm, mixed thermal mass | 95.5 to 97.5% | Warpage, head-in-pillow, voiding |
| First article of a new build, any class | 2 to 6 points below steady state | Stencil, profile, fixture not yet tuned |
So the honest reading of 98.7% is: this is a mature mixed-SMT line with a large share of fine-pitch work, running at the top of its band, with the first-article transient already absorbed by process control rather than counted. It is not a claim that any board from any design will hit that number, and a supplier who implies otherwise is telling you something about the sales process rather than the factory. For the same view applied to escapes rather than first-pass, see defect escape rate and DPMO targets.
The Seven Questions That Force the Second Number Out
These are the questions a purchasing engineer can send by email. Each one is answerable from data the factory already has, and a supplier unwilling to answer any of them is telling you where the number came from.
| Question | What a solid answer looks like | What evasiveness means |
|---|---|---|
| Unit of count: panel, board, or assembly | A named unit plus how X-outs are treated | Generic "boards" with no X-out policy |
| Which IPC class judges the count | Class 2 or 3 explicitly, per product family | No class named, undefined criteria |
| Is rework excluded from the numerator | Yes, with a separate final-yield figure offered | Only one number exists |
| Test coverage behind the yield | AOI plus X-ray plus ICT or FCT, with percentages | AOI only, presented as full test |
| Sample size and date range | A defined window and unit count, e.g. last 90 days, N=12,000 | A number with no period attached |
| Split by defect bucket | Print, placement, reflow, test false-fail | One aggregate percentage |
| First-article transient policy | Separate FPY reported for the first build | New builds blended into mature average |
How to Audit a Yield Claim in One Day
A one-day audit does not need statistics software. It needs four artefacts and arithmetic that a buyer can redo on a laptop. Ask for the following, in this order.
Work order traveller for one week
The traveller records the quantity started, the quantity that reached test, and the rework loops. Count entries against exits. If more boards left test than entered it, the traveller is being written up after the fact.
AOI and X-ray logs with timestamps
Two things to check: that the log covers every board in the traveller, and that the failure codes are specific. A single generic code covering under-deposit, bridging and misalignment is a sign the data is collected for the certificate rather than for the process.
Rework station log, cross-referenced to the traveller
Every rework entry should map to a board that appears as a failure in the first-pass records. Rework entries without a matching first-pass failure mean failures are being absorbed into rework upstream of the count. The rework categories themselves are a useful read on where the factory's real problem sits, described in our escape rate analysis.
Test coverage report for the same part number
Divide the reported yield by the coverage. A 98.7% yield behind 60% structural test coverage is not equivalent to the same number behind 95%. This is the step most audits skip, and it is the one that changes the conclusion. The method is laid out in ICT test coverage percentage audit.
What We Report, and What We Refuse to Report
Three commitments on how yield data leaves our building. First, every quote carries a named FPY band for the specific product profile, not a single site-wide figure. Second, the definition travels with the number: unit of count, IPC class, whether rework is excluded, and the coverage behind it. Third, the first-article build is reported separately from steady state, so a customer never sees a mature-line average applied to a board that has not yet run.
What we will not do is substitute a headline for a definition. A yield number without its denominator is a marketing artefact. The diagnostic view of a falling yield, once the definition is agreed, is covered in the five-point FPY diagnosis, and the improvement programme with cost attached is in the costed FPY playbook.
Frequently Asked Questions
Is 98.7% first pass yield good? For mixed SMT with a significant share of 0.4 mm pitch and BGA work, yes. It sits at the top of the 97.0 to 98.8% band for fine-pitch mixes. For a board made only of 0603 passives it would be mediocre, because the achievable band there is 99.2% and above.
Why not just quote final yield? Because final yield hides the rework burden, and the rework is where latent defects come from. A line at 99.6% final yield with 0.9% rework is handling 9,000 units per million by hand. Quoting both numbers is the only way to see that.
Can I compare FPY across suppliers? Only after both have stated the unit of count, IPC class, rework exclusion and test coverage. Without those four, the comparison is between definitions, not between factories. Ask for the seven questions above and compare the answers first.
What moves FPY fastest? In our experience, test false-failure elimination and stencil aperture review, because both act on the largest buckets without touching the design. Component and design changes move it slower and cost more.
Does a low first-article yield predict a bad supplier? Not by itself. First articles run 2 to 6 points below steady state on every line, because the stencil, profile and fixture have not been tuned for that board yet. What matters is the slope from first article to the third build, and whether the supplier shows you that slope.
Get a Yield Claim You Can Audit
Send your Gerbers, BOM and expected volume, and the quote comes back with an FPY band for your product profile, the definition behind it, and the test coverage that produces it. If you are currently evaluating a supplier's yield claim, the seven questions above can be sent verbatim, and our answer to them is available before you place an order.