

First pass yield is the single number every PCBA buyer asks for and almost no buyer verifies. It appears on capability decks, in quote cover letters, and in quarterly business reviews. It is also the most malleable metric in SMT contracting, because FPY is a ratio, and the industry has never agreed on what belongs in the bottom half of that ratio.
This is not a story about dishonest suppliers. It is a story about a metric with five undefined variables. Two suppliers can run the same board on comparable equipment, hit the same defect rate to within a tenth of a point, and still report figures that differ by four percentage points, both correctly, both in good faith. If you are benchmarking suppliers on FPY, or writing it into a purchase order as a performance obligation, you need to know which five decisions produce that spread before you compare anything.
What FPY Actually Measures
First pass yield answers one narrow question: of everything that entered the line, how much came out conforming without being touched a second time? The word "first" is doing all the work in that sentence. A board that failed AOI, went to rework, was re-tested, and then passed does not count as a first pass success. It counts as a unit that eventually shipped conforming.
That distinction matters commercially because rework is where the hidden cost of a weak process lives. Every reworked board consumes technician time, risks pad and component damage, resets its thermal history, and carries a measurably higher field failure rate than a board that passed clean. A supplier reporting 99% FPY with 3% of output going through rework is describing a different factory from one reporting 96% FPY with no rework at all, and the second factory is usually the healthier one.
Two related metrics get confused with FPY constantly, and they should not be:
- Rolled throughput yield (RTY) multiplies the first-pass yield of every process step. If printing runs 98.5%, placement 99.7%, reflow 99.6%, and test 99.2%, RTY is 0.985 × 0.997 × 0.996 × 0.992 = 97.1%, not the 99.2% that test alone reported. RTY is the honest end-to-end number.
- Final yield counts everything that eventually shipped conforming, including reworked units. It is always the highest of the three and the least informative.
The gap between RTY and final yield is the rework burden. On a mature automotive line that gap is typically under one point. On a new product introduction it can be eight or ten. Our quality metrics and DPPM benchmark guide covers how these three ratios relate to defect rate, and our five-point FPY diagnosis method covers what to do when the number drops.
How to Calculate SMT First Pass Yield: The Formula and Its Five Variables
The arithmetic is trivial. The definitions are not. The formula on every capability deck is units passing first inspection divided by units entering first inspection, expressed as a percentage. What that page never tells you is what "units" means, what "first inspection" covers, and which defects are counted against the pass.
Short answer, for the search snippet: SMT first pass yield is the number of boards that pass first inspection divided by the number of boards that entered the line, multiplied by 100. It differs from rolled throughput yield, which multiplies the yield of each process step. A reported FPY is only comparable when the denominator definition, inspection boundary, and inclusion rules are stated alongside it.
Five decisions determine the number, and each one is defensible. That is exactly the problem.
The Base Unit: Board, Panel, or Placement
Board-level FPY treats a panel with one bad board as a partial failure and a panel with three bad boards as one failure. Placement-level yield (sometimes called DPMO or defect rate) counts every individual joint and package. On a 4-up panel carrying 2,400 placements, one defect gives 99.96% placement yield but 75% board yield. Suppliers with a strong process quote placement yield because it flatters them by three orders of magnitude.
The Denominator: Panel Count, Board Count, or Good Placement Opportunities
The denominator is where the spread is largest. Counting panels favours the supplier when panels are 2-up and heavily penalises them when panels are 12-up. Counting boards is the common industry convention and the fairest basis for comparison. Counting placement opportunities converts the metric into DPMO and stops being FPY at all. A 12-up panel with four bad boards is 66.7% panel yield and 91.7% board yield, an enormous difference from one physical event.
The Inspection Boundary: Where the "First Pass" Ends
Does the pass require SPI and AOI only, or AOI plus electrical test, or AOI plus ICT plus functional test? Every test stage added to the boundary lowers FPY. Many suppliers report the SMT-stage FPY (AOI only) and separately the assembled FPY (AOI plus ICT plus FCT), then quote whichever is higher in marketing material. The assembled figure is almost always four to six points lower, and it is the one the customer actually experiences. See our comparison of ICT and FCT coverage for how much each stage catches.
Defect Attribution: Who Owns a Component Failure
A board that fails because a capacitor arrived with a cracked termination is a component defect, not a process defect. Some factories exclude supplier-attributable and design-attributable failures from the FPY numerator; others do not. A mature BOM with a known-bad reel can swing reported FPY by several points purely on attribution policy. Our solder paste defect attribution guide applies the same logic to paste-related failures. The attribution policy is worthless unless it is recorded per defect, not applied after the fact.
Sampling: Census or Sample Inspection
If AOI covers 100% of boards but X-ray covers a sample, the X-ray-catchable defects that AOI misses are invisible to the FPY count. A supplier sampling 10% at X-ray understates its true defect population by an unknown factor. Census inspection is the only basis on which the number is auditable. Our inspection methods guide covers what each station can and cannot see.

The Denominator Audit: Five Decisions That Move the Number 2-5 Points
Run the same physical panel through the five definitions above and you get a spread wide enough to reverse a sourcing decision. The table below works a single case: a 12-up panel, 2,400 placements per board, 10,000 boards built, 187 true defects distributed so that 163 boards failed, and 9 boards were scrapped outright.
| Reporting Basis | Numerator | Denominator | Reported FPY |
|---|---|---|---|
| Placement-level, defects only (DPMO basis) | 23,812,813 good placements | 24,000,000 placements | 99.22% |
| Board-level, AOI boundary, supplier defects excluded | 9,837 boards | 9,837 boards | 99.96%* |
| Board-level, AOI boundary, all defects counted | 9,837 boards | 10,000 boards | 98.37% |
| Board-level, AOI + ICT boundary, all defects counted | 9,791 boards | 10,000 boards | 97.91% |
| Panel-level, AOI boundary, all defects | 769 panels | 834 panels | 92.21% |
The same shift produced 99.22% on a placement basis and 92.21% on a panel basis. That is a 7-point spread from arithmetic alone, before anyone has touched the process. The asterisk on the second row is deliberate: excluding supplier-attributable defects from the numerator while keeping them in the denominator is a common and meaningless construction, because it removes the failure from the numerator but not from the population it came out of. That row should be read as a warning, not a benchmark.
The practically important spread is narrower but still decisive. Between the two most common honest conventions, board-level at the AOI boundary and board-level at the AOI-plus-ICT boundary, the difference on this panel is 0.46 points. Add a design-attributable exclusion policy on top and the same shift can read 98.4% or 99.2%. Now put that in front of two suppliers being compared for a three-year contract and the number has stopped measuring the thing you are trying to measure.
Our production lines run 3D SPI, pre- and post-reflow AOI, and X-ray on 100% of BGA and QFN sites, with 2D and 3D SPI feeding real-time SPC, so the FPY number we quote is built on census inspection of the SMT stage rather than a sample. That is a statement about the inspection boundary, not about the process, and the distinction is the entire point of this section.
Where the Defects Actually Come From on a Modern Line
First pass yield rarely fails evenly. On a well-run line with fine-pitch content, the defect population concentrates in one or two stations, and knowing which one tells you what the number is really measuring.
| Process Stage | Typical Share of SMT Defects | Dominant Failure Modes |
|---|---|---|
| Solder paste printing | 50-65% | Insufficient volume, bridging, slumping, misregistration |
| Component placement | 15-25% | Offset, missing part, wrong part, tombstoning |
| Reflow | 10-20% | Insufficient wetting, voiding, warpage-driven opens |
| Board and component incoming | 5-15% | Pad contamination, warped laminate, damaged terminations |
Printing dominating at 50-65% is the reason a paste-volume control programme is the highest-leverage FPY intervention available, and also the reason FPY claims built on placement-level arithmetic are so flattering: printing defects are sparse but clustered, so they cost whole boards while barely moving a placement-level percentage. Our SPI volume control and Cpk guide covers the control method, and the costed FPY improvement playbook covers the sequence to fix it in.
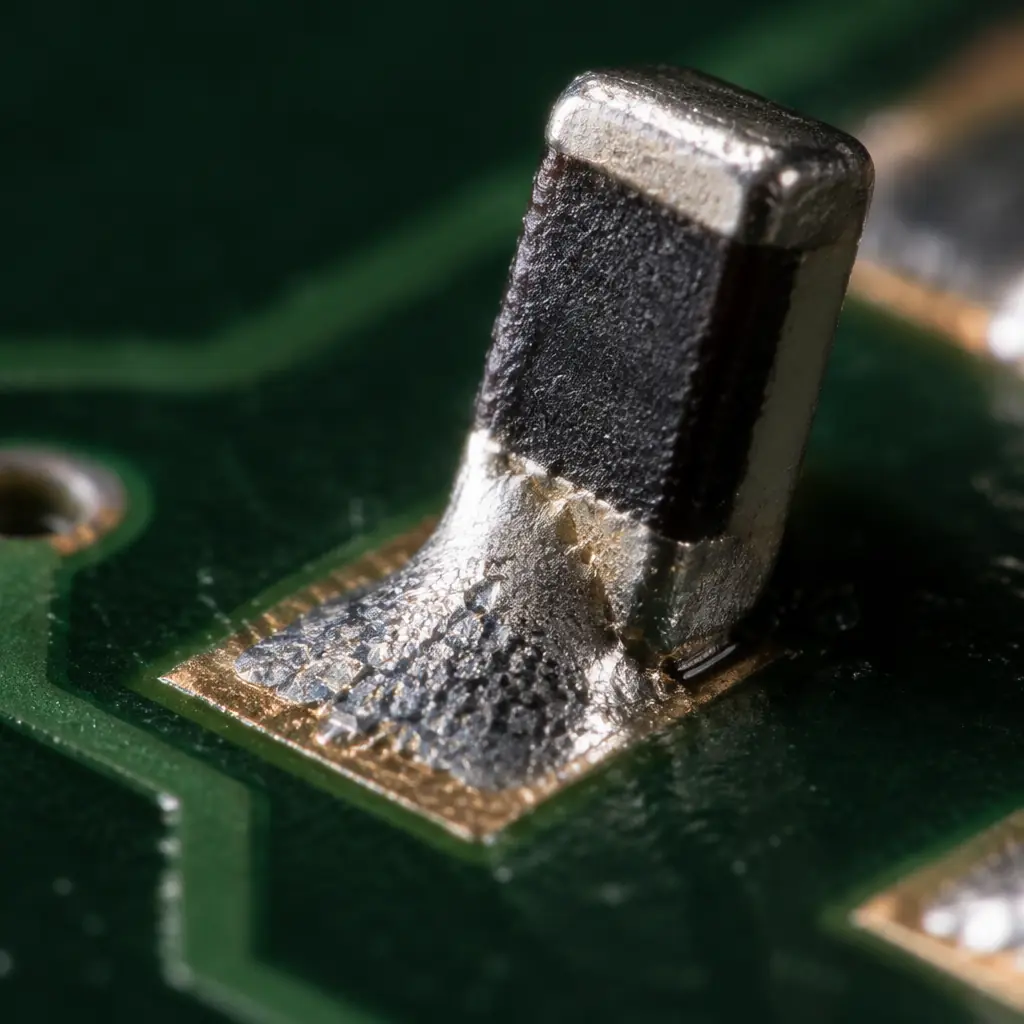
The rework side is where the metric stops being abstract. A board pulled for a printing defect goes through removal, pad cleaning, replacement paste deposit, re-placement and a second reflow. Each of those steps adds risk, and the resulting unit is no longer equivalent to one that passed clean. This is why a factory at 96% FPY with strict no-rework-on-class-3 discipline is a better bet than a factory at 99% that quietly reworks everything.

The FPY Clause to Put in Your Purchase Order
If first pass yield is a contractual obligation, it needs a definition clause as precise as any dimensional tolerance. The clause below is deliberately short and deliberately complete; every sentence closes one of the five variables.
Suggested clause language. "First pass yield shall mean the number of printed circuit board assemblies that pass inspection at the stage defined in Schedule A without rework, repair, or touch-up, divided by the number of assemblies entering the line in the same lot, expressed as a percentage. The base unit shall be the individual board, not the production panel. Inspection shall be 100% AOI for all lots and 100% X-ray for all BGA and QFN sites. Defects shall be attributed by the supplier at the time of detection to process, component, or design origin, and only process-origin defects may be excluded from the numerator, with the attribution record supplied on request. Reported yield below [X]% for two consecutive lots shall trigger a corrective action request under the quality agreement."
Three practical notes on using it. First, Schedule A must name the inspection stages explicitly, because "inspection" alone will be read as AOI-only by the supplier and as end-of-line by your quality team. Second, the attribution record requirement is what makes the exclusion policy auditable; without per-defect records the policy is applied retrospectively and always in the supplier's favour. Third, set the trigger threshold from your own field failure data rather than from the industry benchmark, because the cost of a reworked board reaching your customer is specific to your product.
For the wider supplier management context, our supplier quality scorecard guide covers how to weight FPY against DPPM, on-time delivery, and responsiveness, and our defect escape rate guide covers the complementary metric that FPY by definition cannot capture: the defects that pass first inspection and reach the field anyway.
Summary: Audit the Definition Before You Benchmark the Number
First pass yield is a legitimate metric undermined by an illegitimate comparison practice. The number itself is arithmetic; the meaning of the number depends entirely on five definitions that the industry has never standardised. A buyer who asks "what is your FPY" gets a marketing figure. A buyer who asks "board-level or panel-level, what inspection boundary, how are component failures attributed, and can I see the per-defect records" gets a number that can be compared to something.
At Huaxing PCBA we operate 9 high-speed SMT lines and 5 DIP lines with 3D SPI, pre- and post-reflow AOI, and 100% X-ray on BGA and QFN sites, under IATF 16949 and ISO 9001. When you ask for a first pass yield figure on a quote, we supply the definition alongside it. Read our quality metrics guide for the surrounding benchmarks, or send your BOM and Gerbers and ask for the FPY basis in writing.