
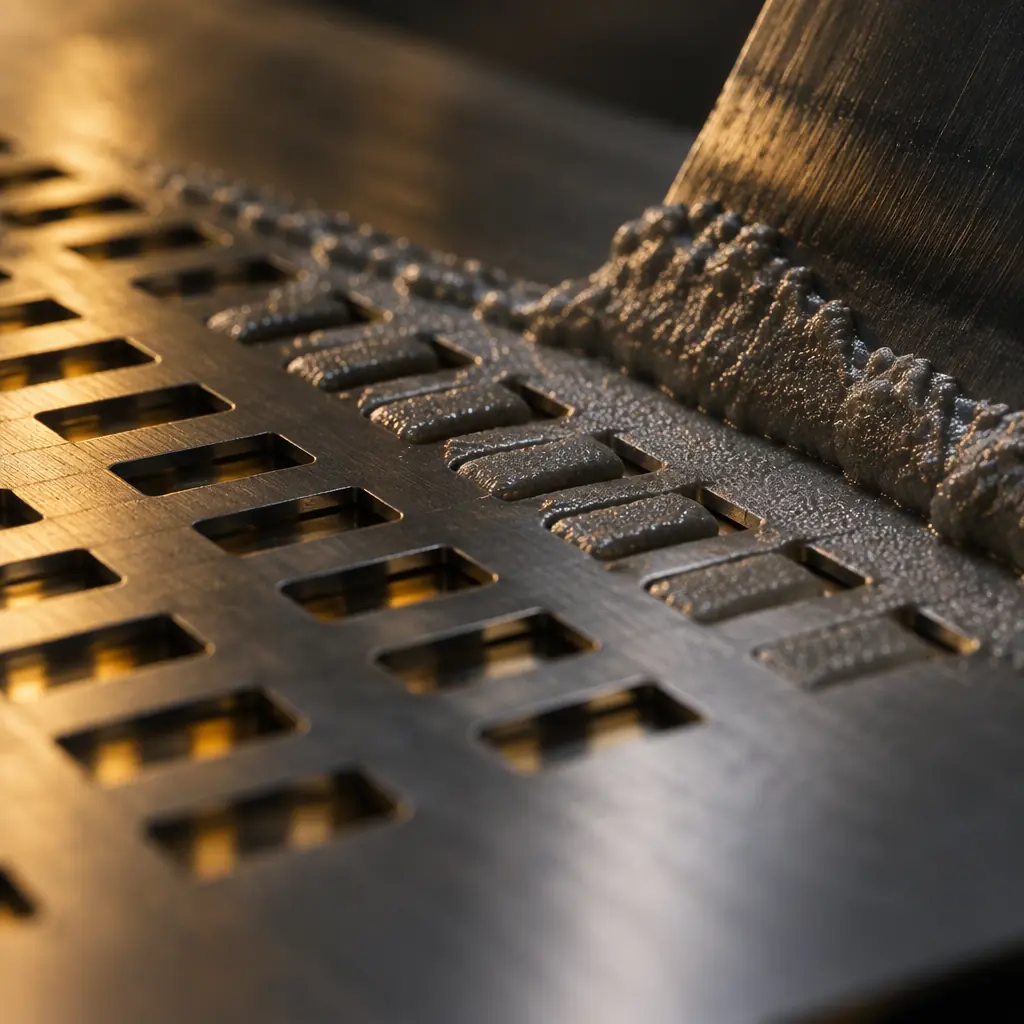
Insufficient solder paste is the most argued-about defect on an SMT line because it is the one most often attributed to the wrong party. The supplier says the stencil is fine. The customer says the volume is low. Both are reading the same SPI report and neither has done the arithmetic that says what the volume should have been.
That arithmetic is short, and doing it first changes the conversation. A deposit has a target volume in cubic millimetres, derived from the aperture area and the foil thickness with a transfer-efficiency allowance. Once that number exists, a short deposit is no longer an opinion: it is a measurable shortfall with four possible physical explanations, and each one leaves a different signature in the data.
Step One: What the Deposit Volume Should Have Been
The target deposit volume is the aperture area multiplied by the foil thickness, reduced by the fraction of paste that actually transfers out of the aperture onto the pad. For a rectangular aperture the calculation runs as follows.
| Input | Worked Example | Why It Matters |
|---|---|---|
| Aperture dimensions | 0.20 mm × 0.50 mm = 0.100 mm² | Sets the base volume; area ratio follows from it |
| Foil thickness | 0.12 mm (typical for 0.5 mm pitch) | Directly proportional to volume |
| Geometric volume | 0.100 × 0.12 = 0.0120 mm³ | The maximum if every cubic millimetre released |
| Transfer efficiency | 0.80 for a well-formed aperture | Paste adhering to aperture walls never transfers |
| Target deposit volume | 0.0120 × 0.80 = 0.0096 mm³ | The number the SPI report should be compared against |
The transfer-efficiency figure is where most disputes originate, because it is not a constant. It is a function of the aperture's area ratio, which is the aperture opening area divided by the total internal wall area. An aperture that is wide and shallow releases paste readily; one that is narrow and deep traps it against the walls.
Area ratio: aperture opening area ÷ (aperture perimeter × foil thickness). Below 0.66, transfer efficiency falls away faster than foil thickness can compensate for, and no amount of printer tuning recovers the volume. This is a stencil design limit, not a process setting.
For the 0.20 × 0.50 mm aperture in 0.12 mm foil, the area ratio works out at 0.71, comfortably above the threshold. Reduce the aperture to 0.15 mm on the same foil and the area ratio falls to about 0.58, and the expected transfer efficiency drops from roughly 0.80 to somewhere near 0.60. The target volume falls by a third without a single printer setting changing.
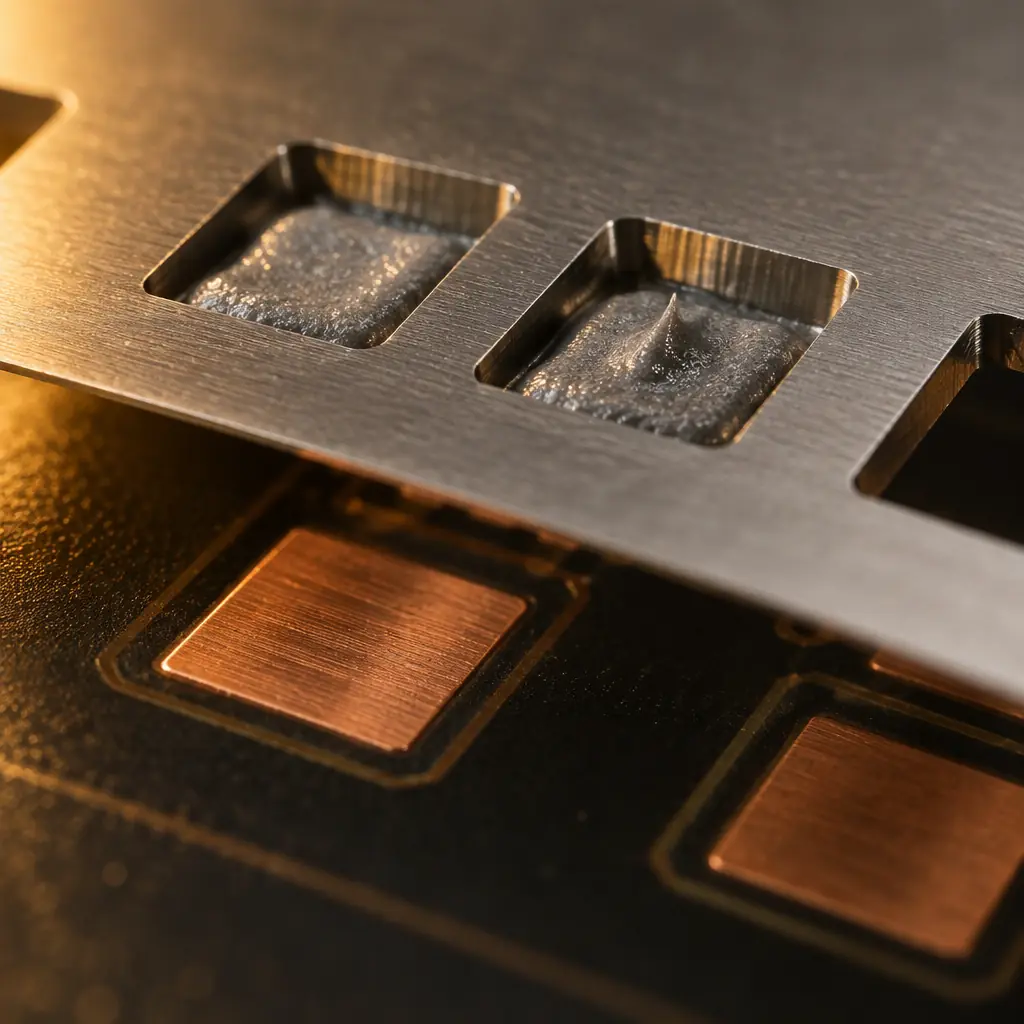
Step Two: Which of the Four Causes the Signature Points To
A low SPI volume reading is consistent with four physically distinct failures. They are separable because each changes a different combination of volume, area and height, and because each appears in a different pattern across the panel.
Cause 1 — Aperture Geometry Below the Release Threshold
The deposit footprint is visibly smaller than the aperture, and the shortfall is consistent across every board and every shift. This is the only one of the four causes that cannot be corrected by process adjustment, because the paste simply cannot leave a channel that narrow. The confirmation is arithmetic rather than experimental: calculate the area ratio for the aperture in question. Below 0.66, the geometry is the cause and the answer is a thinner foil or a redesigned aperture, which is a stencil conversation.
The design side of this trade-off, including how aperture size and foil thickness are chosen together, is set out in our stencil aperture design guide.
Cause 2 — Paste Rheology Drifted Out of Its Working Window
The deposits are short but clean-edged, and the shortfall worsens through a shift and resets after a paste change or a stencil clean. Viscosity rises as solvent evaporates from paste sitting on the stencil, and higher viscosity resists release from the aperture walls. The signature is temporal: the same aperture delivers acceptable volume at 08:00 and low volume at 14:00, on the same stencil, with the same settings.
This cause is distinguishable from geometry by asking whether the volume trend exists within a single lot. Geometry produces a flat line that is simply too low. Rheology produces a downward slope that resets. Our guide to solder paste rheology and slump covers the viscosity and open-time behaviour behind that curve, and the handling rules that keep it flat are in our paste storage and handling guide.
Cause 3 — The Printer Seal Failed at Specific Positions
Skipped or near-zero deposits appear in a pattern that follows board position rather than aperture size: pads over a via, pads near the board edge, pads adjacent to a component cavity on the underside. When the stencil does not sit flat against the pad, paste escapes sideways under the foil instead of transferring down onto the pad.
The tell is locality. Geometry and rheology affect all instances of an aperture class equally; a seal failure affects the instances at one physical location. Supporting the board properly and checking stencil tension are the corrections, and a board with a mix of thicknesses or a large cut-out needs support tooling that a flat bed does not provide.
Cause 4 — The Pad Finish Is Not Wetting
Deposits transfer correctly but pull back off the pad on separation, leaving a short deposit on some finishes and a correct one on others within the same panel. This is the least common of the four and the most often misattributed to paste, because the paste is behaving exactly as specified against a surface that will not accept it.
The diagnostic is a finish comparison: if the same paste, stencil and settings deliver acceptable volume on one finish and short volume on another, the finish is the variable. Our surface finish selection guide sets out where the finishes differ in wetting behaviour and what that means for a print process.

Step Three: The Questions That Assign the Cause in One Conversation
Four causes can be separated by four questions, asked in order. Each answer eliminates one path, and the conversation ends with an owner rather than an assertion.
| Question | If Yes | If No |
|---|---|---|
| Does the shortfall affect every instance of this aperture class equally? | Geometry or paste, not seal. Go to question 2. | Seal or support failure at a location. Check board support and stencil tension. |
| Does the volume trend down within a shift and reset after cleaning? | Rheology. Check open time, lot age, humidity. | Settings or geometry. Go to question 3. |
| Is the aperture area ratio above 0.66? | Process settings. Separation speed and pressure are the levers. | Geometry. The stencil must change; no setting will recover this. |
| Does the same paste deliver acceptable volume on a different pad finish? | Finish is the variable, not the paste or the stencil. | Paste formulation or lot. Escalate to the material supplier with the lot number. |
The value of running these in order is that the two expensive answers, new tooling and a material complaint, come last and only after the cheap explanations are exhausted. Programs that skip to the expensive answer first spend tooling money on pressure problems and file material complaints against stencils that were never at fault.
Step Four: The Six Numbers That Stop It Recurring
Resolving one occurrence of insufficient paste is a shift's work. Preventing the argument from returning is a matter of recording six values per lot, so that the next occurrence can be compared against a baseline instead of re-investigated from zero.
SPI volume mean and sigma, reported per aperture class
A board-wide average conceals a fine-pitch aperture drifting low while 0402 deposits run high. Reporting per aperture class is what makes the number comparable to the acceptance limit that applies to that class.
Area ratio for every aperture below 0.75
Recording the computed value once, at stencil design sign-off, means a low-volume complaint can be checked against geometry in seconds rather than after a trial. Apertures already close to the threshold are the ones that will produce the complaint.
Paste lot number and open time at end of run
Rheology failures cluster at the end of a lot's working life. Without the lot number, "paste problems this week" cannot be turned into a statement about a specific material batch.
Stencil ID and print count since last clean
Clogging is a function of prints, not calendar hours. A drift that looks random becomes entirely predictable once prints-since-clean is recorded.
Separation speed and squeegee pressure as run
The two parameters adjusted most often between shifts, and therefore the two most often adjusted without record. Logging them as-run is what allows a defect to be correlated with a change.
Pad finish and board finish lot for the panel
Deposit volume behaves differently on ENIG than on an organic finish. A finish change mid-program can imitate a paste problem exactly, and only the lot record distinguishes the two.
The Tolerance Band: What Counts as Insufficient at All
Before any of the four causes is investigated, the shortfall has to clear the acceptance band. A deposit at 92 percent of target is not insufficient solder paste, it is a normal deposit inside the process window, and chasing it wastes a shift. Printing acceptance limits are stated as a percentage of target volume, and the band is wide enough that a substantial share of what gets escalated as low volume is simply measurement noise.
| Volume vs Target | Classification | Action |
|---|---|---|
| 85–115 percent | In specification | None. Record the number and trend it. |
| 75–85 percent | Marginal | Investigate if the trend is downward or the count is rising. |
| Below 75 percent | Insufficient | Clean the stencil, then diagnose by cause. |
| Below 50 percent or zero | Missing or starved | Stop the print. Seal or clogging failure first. |
Two caveats make that table work in practice. The first is that the band applies per aperture class; a 0201 aperture and a QFP lead aperture do not share a meaningful absolute tolerance, because their base volumes differ by more than an order of magnitude. The second is that the band assumes the target itself was computed rather than assumed. A program that set its limit as a nominal number without doing the area ratio calculation is measuring against a figure that may already be too low or too high for that aperture.
The companion failure on the high side follows the same logic. Excess paste is usually treated as a separate defect class, but it has one shared root with insufficient paste: both are transfer-efficiency problems, and both respond to the same separation-speed adjustment in opposite directions. A line that corrects a torn deposit by slowing separation and then finds its volume running high has not created a new defect, it has moved past the centre of one window.
Bridging and Insufficient Paste Share a Starting Point
Design and process engineers tend to treat bridging and insufficient paste as opposite problems, one from too much paste and one from too little, and therefore as unrelated. At the level of what causes them they overlap far more than that framing suggests. Both are governed by the transfer step: how much paste releases, where it lands, and whether it stays where it was placed.
That is why the same separation-speed adjustment can fix a torn deposit and create a bridge, and why a mask dam that is too narrow produces bridging at one pitch and starved pads at another. Working the two defects as one family rather than two is what stops a line from oscillating between them, tightening one parameter until the other defect appears. The bridging side of that trade-off, including the paste-level versus reflow-level split that decides whether the print or the reflow profile is at fault, is covered in our solder paste bridging guide.
What to Ask a Supplier Before Accepting Their Volume Claim
The six recorded values above are what makes a supplier's volume claim checkable, but they only exist if the supplier was asked for them at the point of award. Four questions cover it, and none of them requires the buyer to have a printer on site.
Is volume reported per aperture class or as a panel average?
A panel average is the single most effective way to hide a fine-pitch aperture running at 70 percent while coarse deposits run at 105. The two cancel, the average looks healthy, and the defect ships. Per-class reporting is the only form in which the number can be checked against a limit that differs by class.
Are area ratios below 0.75 flagged at stencil design review?
Asking this before the stencil is cut is the difference between a design conversation and a tooling change order. A supplier who reviews area ratios at design stage can propose a thinner foil or an adjusted aperture while both are still free.
What is the SPI sampling rate, and is it 100 percent?
A sampling SPI reports a rate on the boards it measured and nothing about the rest. For a fine-pitch product where the print is the dominant yield risk, 100 percent capture is the only rate at which a per-lot volume trend means what it appears to mean.
Who owns a paste defect after the print, and what is the gate?
A supplier who cannot name the owning input for each defect class will resolve complaints by negotiation rather than by data. The attribution structure that makes the answer mechanical is set out in our defect attribution method.
How This Fits With the Wider Defect Picture
Insufficient paste is one of eight common printing signatures, and it shares its root causes with several of them. Torn deposits and dog-earing come from the same transfer-efficiency failure, and clogging late in a shift is the same rheology drift. Working by root cause rather than by defect name means one adjustment can close several signatures at once, which is why our guide to solder paste printing defects groups them by cause rather than listing them alphabetically.
When the question stops being how to fix the defect and becomes who owns it, the framing changes: a supplier complaint needs each defect class assigned to a responsible input with numeric gates attached, which is what our solder paste defect attribution method sets out. And when the argument is about money rather than cause, our breakdown of what each printing defect costs puts a figure on the rework and scrap behind each signature.
At Huaxing PCBA, every print runs through SPI with 100 percent volume capture, and volume is reported per aperture class rather than as a panel average. Stencil area ratios are checked at design review, so apertures that cannot release paste are flagged before a stencil is cut rather than after a complaint. Send your Gerber and BOM for a free DFM review and quote, and the aperture geometry gets reviewed alongside the rest of the design.