
A reflow profile is a curve with roughly five numbers that matter: ramp rate out of ambient, soak temperature and duration, ramp to peak, time above liquidus, and peak temperature. Each of those has an upper and a lower limit. Historically an engineer read the six or seven values off a chart and checked each one against the paste datasheet by hand, a process that worked but did not scale and did not produce a single number a buyer could put in a PPAP package.
The Process Window Index replaced that with one figure. It compresses every measured parameter across every thermocouple into a percentage of the available process window, where lower is better and 100% means you are sitting exactly on a limit. It is now standard equipment output on most profiling systems and appears in reflow reports throughout the industry.
The problem is that PWI is a normalised score, and normalisation requires a denominator. The report says "PWI 68%". It almost never says which window that 68% was normalised against. That omission makes the number non-comparable between suppliers, and occasionally meaningless within a single report.

What PWI Is and Why It Replaced Pass/Fail Profiling
Manual profile review had three weaknesses. It was slow, since each thermocouple had to be read against each parameter. It was binary, so a profile that sat exactly on the upper soak limit looked identical to one comfortably in the middle, even though the first has no margin for oven drift. And it gave no way to compare two profiles of the same board on different lines or at different times.
PWI fixes all three. It collapses many parameters and many thermocouples into one comparable score, it expresses margin rather than mere conformance, and it is computed identically every time so profiles can be trended. A profile at PWI 41% has substantially more room before it drifts out of window than one at PWI 88%, and that difference is visible at a glance in a way that six hand-checked values never were.
What it does not do, and cannot do, is tell you whether the window it was scored against is the right one for your assembly. That judgement stays with the process engineer. Our guide to what a PWI report must show covers the document side; this page covers the arithmetic.
How Process Window Index Is Calculated
PWI scores every measured parameter as a percentage of its distance from the centre of the window, normalised so that 100% corresponds to a limit. For a parameter with a two-sided window the score is the deviation from centre divided by half the window width. For a one-sided window, such as a maximum ramp rate, the score is the deviation from the most favourable end divided by the full window width.
Short answer, for the search snippet: The Process Window Index is calculated by scoring each profile parameter as a percentage of its distance from the centre of its specification window, then taking the highest scoring parameter across all thermocouples. A two-sided parameter scores as the absolute deviation from window centre divided by half the window width; a one-sided parameter scores as the deviation from the best-case end divided by the full window width. PWI below 100% means every parameter is inside the window.
Two consequences follow directly from that definition, and both are routinely overlooked.
PWI Is Set by the Worst Parameter, Not the Average
Because the reported figure is the maximum across parameters and thermocouples, one badly placed thermocouple dominates the score. A profile with five parameters at 12% and one at 78% reports 78%. This is the correct behaviour, since the weakest link governs the process, but it means a PWI figure tells you nothing about how many parameters are close to the limit, only that at least one is at that distance.
The Score Is Meaningless Without the Window Definition
Halving the width of a window doubles every score inside it. A profile scored against a narrow internal window will report a higher PWI than the same profile scored against a wider datasheet window, and the profile has not changed at all. This is the single most common source of confusion when comparing reflow reports from two suppliers, and it is not a sign of anyone being careless. The window is simply a parameter of the calculation that rarely gets printed.
Worked Example: Four Thermocouples, One Oven, PWI 41% Versus 78%
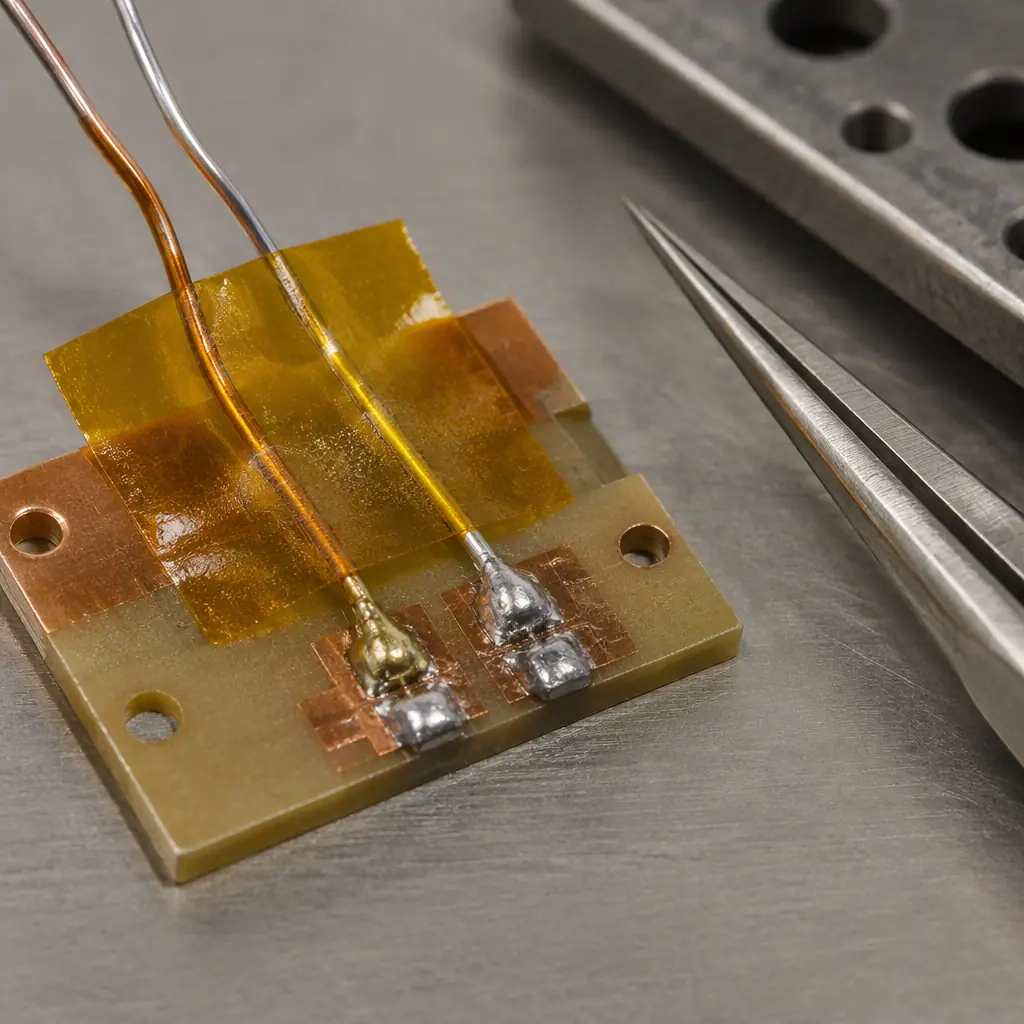
Take a six-layer board with a large ground plane and a fine-pitch QFN, profiled with four thermocouples: one on a small component near the board edge, one on the QFN thermal pad, one in the centre of a large BGA, and one on the board surface at the trailing edge. This distribution is normal for a mixed-massity assembly and produces the classic spread in measured values.
| Parameter | Spec Window | T/C 1 Edge | T/C 2 QFN | T/C 3 BGA | T/C 4 Trailing |
|---|---|---|---|---|---|
| Soak temperature (°C) | 150-190 | 162 | 158 | 155 | 168 |
| Soak time (s) | 60-120 | 92 | 96 | 104 | 88 |
| Ramp to peak (°C/s) | 1.0-3.0 | 2.1 | 1.9 | 1.6 | 2.4 |
| Time above liquidus (s) | 45-90 | 63 | 71 | 84 | 58 |
| Peak temperature (°C) | 235-245 | 238 | 240 | 243 | 236 |
| Reported PWI | — | 27% | 34% | 78% | 41% |
The BGA thermocouple drives the result. Time above liquidus of 84 seconds sits 24 seconds above the window centre of 67.5, and the half-window is 22.5 seconds, so that parameter alone scores 24 ÷ 22.5 = 107%, which would read as a failure. The report shows 78% instead because the supplier scored against a slightly wider internal window of 45-95 seconds, where the half-window is 25 seconds and the same 84-second reading scores 66%. Add the peak temperature contribution and the composite lands at 78%.
That is the entire problem in one paragraph. The BGA thermocouple measurement did not change. The oven did not change. Only the window changed, and the score moved from a failure to a marginal pass. To read such a report correctly you compare the BGA thermocouple's time above liquidus against the paste datasheet yourself, not the composite score. Our reflow profiling and thermocouple placement guide covers where these four probes belong, and the reflow profile optimisation guide covers how to close a gap like this one.

Which Spec Limits: Paste Datasheet, J-STD-001, or Component Ratings
Three legitimate window sources exist, and they produce different scores on identical data. A report that does not name which one it used cannot be compared with anything.
| Window Source | What It Defines | Typical Width | When It Applies |
|---|---|---|---|
| Solder paste datasheet | Recommended profile envelope from the paste manufacturer | Widest | Default for commercial assembly, always defensible |
| J-STD-001 process requirements | Acceptability limits for the soldered connection | Medium | Class 2 and Class 3 contracts, customer flow-down |
| Component and laminate ratings | Maximum body temperature, moisture sensitivity, warpage limits | Varies, often narrowest at peak | Large BGAs, connectors, moisture-sensitive packages |
The paste datasheet window is the widest and therefore produces the lowest PWI. That makes it the most flattering choice, and it is also the most common default, because profiling software ships with a library of paste profiles. It is legitimate as a starting point but insufficient as evidence for a Class 3 assembly, because the paste window describes what the paste tolerates, not what the joint requires.
The narrowest applicable window governs. On a board with a 0.5 mm pitch BGA and a large connector, the component rating for the connector body often sets the peak temperature ceiling tighter than either the paste or the standard, and that ceiling should define the window used in the report. Our moisture sensitivity level guide covers the component-side constraints that usually narrow it.
PWI Bands and What Each Band Actually Buys You
The industry convention treats 100% as the limit, but the useful information is in the bands below it. A score of 85% is inside the window and is not a comfortable place to be.
- Below 50%: substantial margin on every parameter. Oven zone drift, a small ambient shift, or a new paste lot will not push the profile out. This is the target for a validated production profile.
- 50-80%: inside the window with moderate margin. Acceptable for production provided the dominant parameter is identified and monitored. A profile at 78% driven by time above liquidus is more fragile than one at 78% driven by soak time, because the former moves faster with conveyor speed variation.
- 80-100%: inside the window but with very little room. Any variation in board loading, ambient, or paste lot can push a parameter out. Treat as a development profile, not a released one.
- Above 100%: at least one parameter is outside specification. The profile cannot be released regardless of how good the joints look on a sample.
The practical implication for a buyer is that a supplier reporting a PWI in the 50-80% band is describing a process with genuine but limited margin, and the report should name which parameter sets the score so the exposure is visible. A supplier reporting below 50% has a robust profile. A supplier unable to state the dominant parameter has a number without a meaning.
Four Things to Require in the PWI Report
These four items turn a PWI figure from decoration into evidence. They cost the supplier nothing except the discipline of printing what the software already computed.
Name the Window Source and Its Limits
The report should state whether limits came from the paste datasheet, J-STD-001, customer flow-down, or an internal specification, and print the numeric upper and lower bound for each parameter. Without this, the score cannot be recalculated or compared.
List Per-Thermocouple Scores, Not Just the Composite
A composite of 66% tells you one thermocouple reached 66%. It does not tell you that the three others sat at 12%, or which position is the constraint. Per-thermocouple scores are what identify the layout or mass-distribution issue behind the spread.
Identify the Dominant Parameter
The report should say explicitly which parameter produced the maximum score. Time above liquidus and peak temperature respond to different controls, and knowing which one is binding determines whether the fix is conveyor speed, zone setpoint, or board thermal mass.
Re-verify on a Schedule and After Any Change
A PWI is a snapshot of one run. Require re-profiling after any change to paste lot, stencil, oven zone setpoints, board loading pattern, or panel design, and on a defined periodic interval regardless. A profile validated a year ago at PWI 41% may not describe today's oven.
Summary: Read the Parameter, Then the Score
The Process Window Index is a good instrument with one dangerous property: it looks like an absolute number when it is a relative one. Two profiles that both report 66% may have completely different margins, because the window behind each score differed. The way to read any PWI report is to go past the headline and check which limit set was used, what the worst parameter was, and whether the thermocouple positions actually represent your board's thermal mass distribution.
At Huaxing PCBA we profile every assembly on reflow with a minimum of four thermocouples positioned to cover the small-mass, large-mass and high-pitch sites, report per-thermocouple scores against a named limit set, and re-profile on paste lot and stencil change. Our ovens run nitrogen-capable with continuous zone temperature logging, and our nitrogen reflow guide covers the O2 control that sits alongside the profile. Read our solder joint defect guide for what a profile that is drifting out of window looks like on the board, or send your assembly for a profiling review.