PCB pricing is not a mystery. It follows a predictable structure driven by seven variables — and most procurement managers overpay because they optimize the wrong ones. A 10-cent saving on surface finish can cost $2 in yield loss. A $50 design change can save $5,000 in scrap across a production year.
This guide explains exactly what drives PCB cost, with real numbers from our Shenzhen manufacturing facility. We build 80,000㎡ of PCB monthly across 2-32 layer designs, serving 150+ customers in 30+ countries. Every cost factor below reflects actual production economics, not theoretical pricing models.
The 7 Cost Drivers (Ranked by Impact)
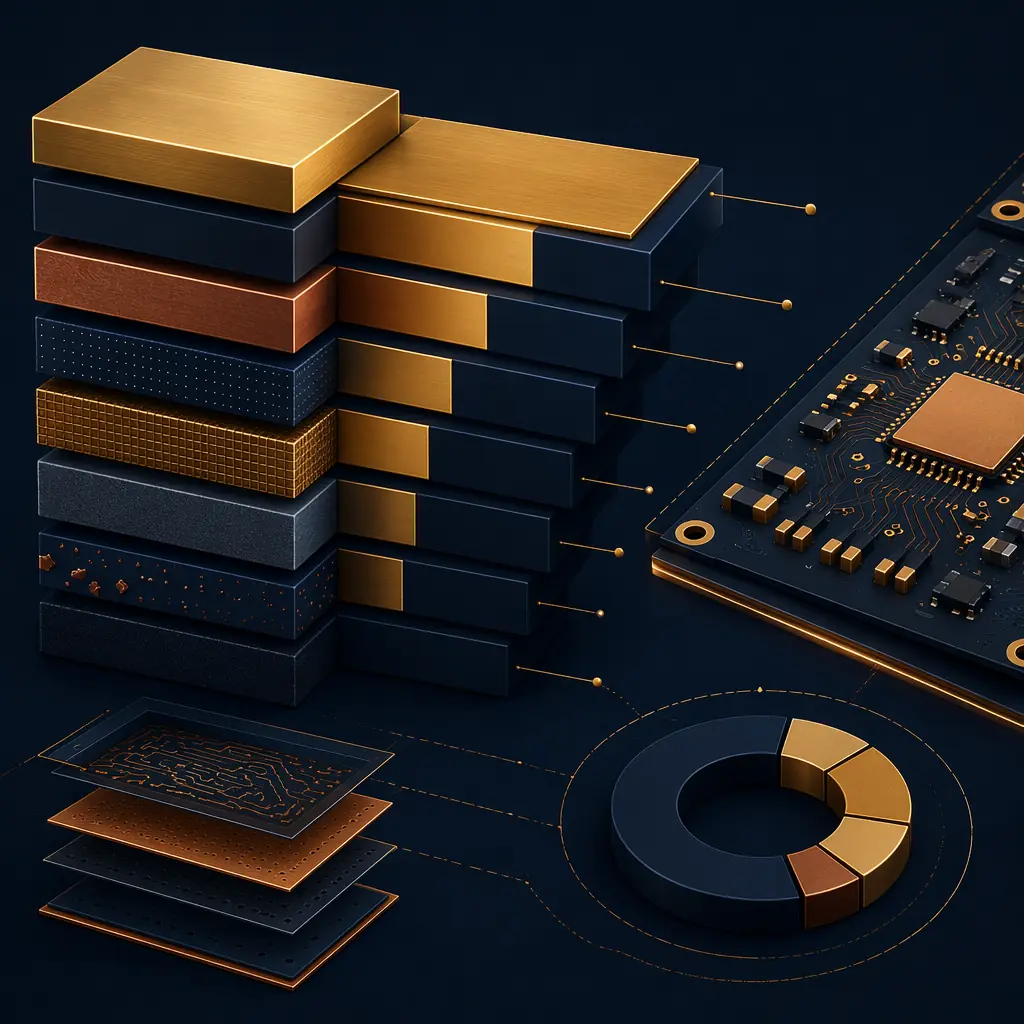
Here are the seven factors that determine your per-unit PCB cost, ranked from highest to lowest impact on a typical 4-layer production order. Percentages represent the approximate contribution to total cost variance between a budget and premium build of the same size:
Layer Count — 30-40% of Cost Variance
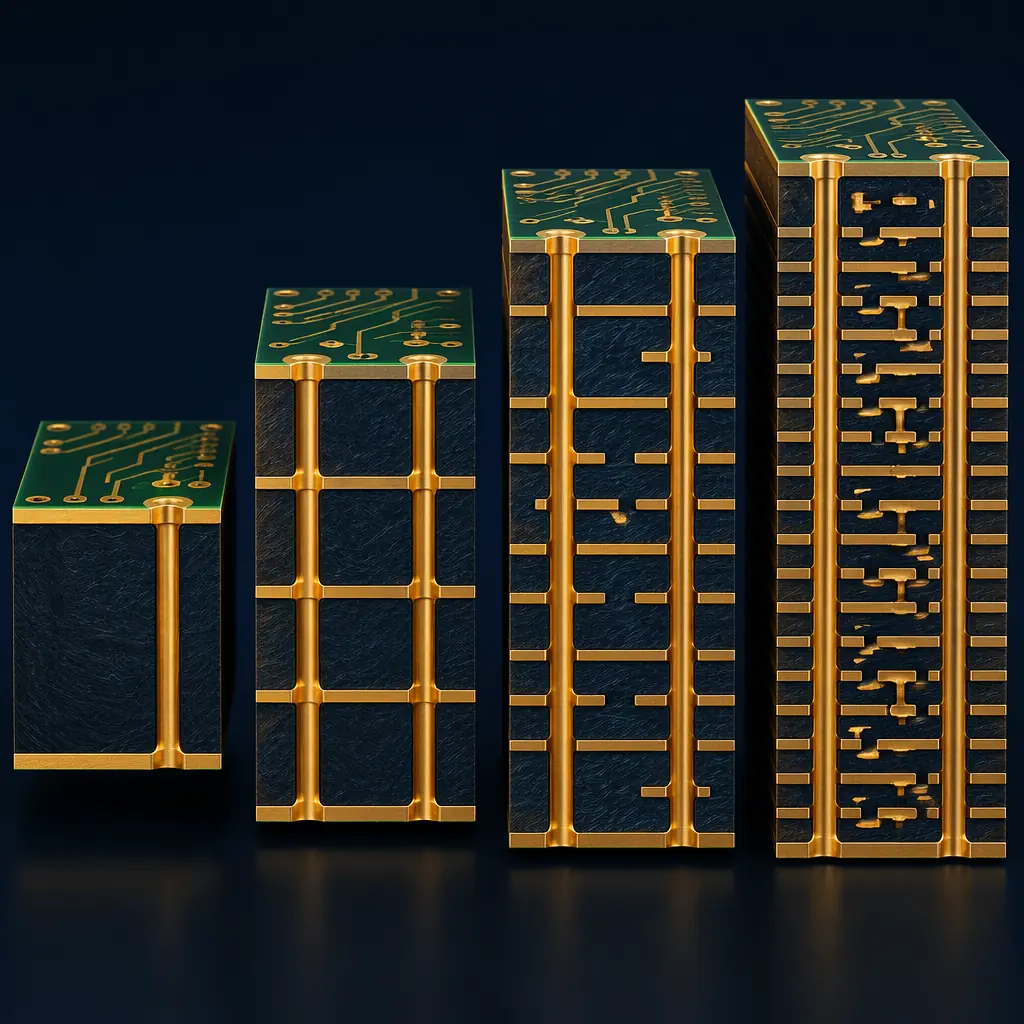
The single biggest cost driver. A 2-layer PCB costs roughly $15-25/panel in volume; a 16-layer PCB costs $120-200/panel. The jump isn't linear — each additional layer pair requires a full lamination cycle, doubling the process steps. See our HDI guide for how microvia technology changes this equation.
Base Material — 15-25% of Cost Variance
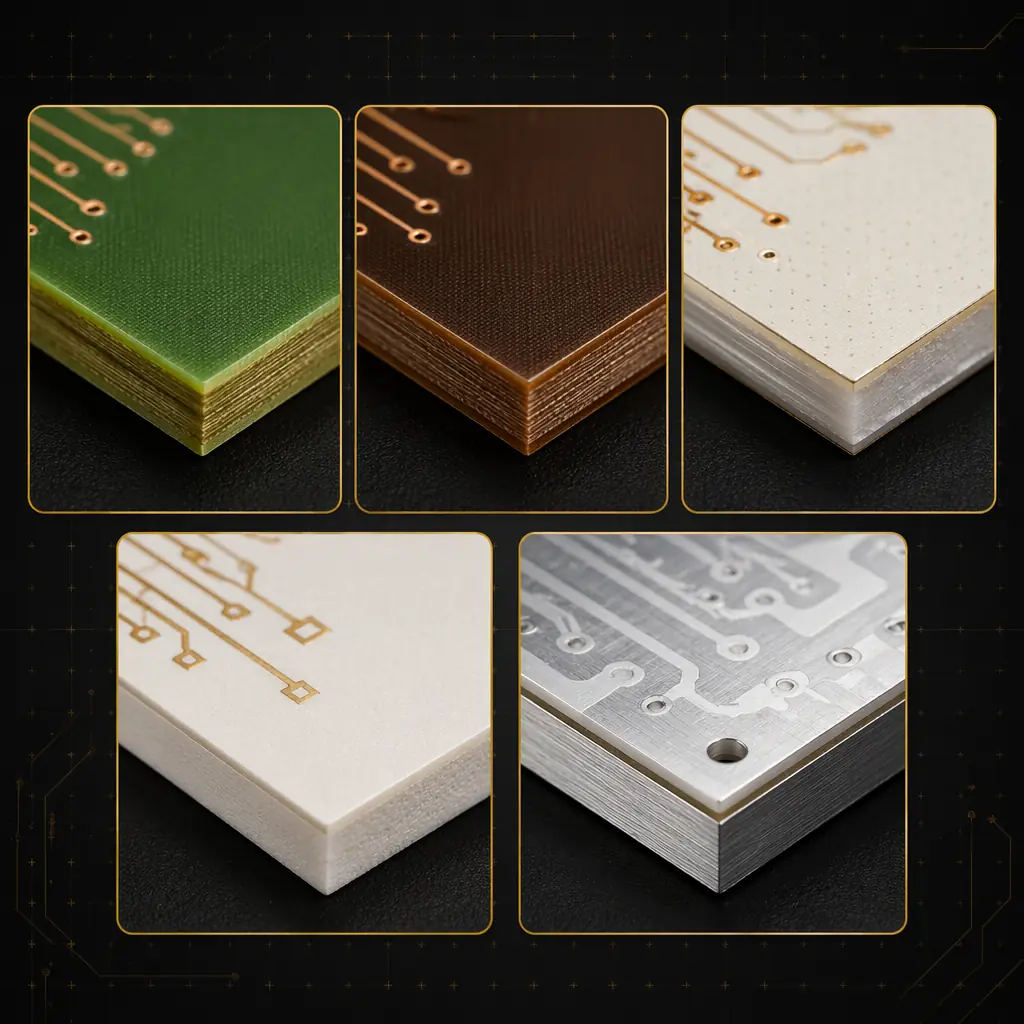
Standard FR-4 (Tg 130°C) is the baseline. Moving to High-Tg FR-4 (Tg 170-180°C) adds 20-30%. Rogers 4350B for RF applications adds 200-400%. Ceramic-filled PTFE for millimeter-wave can add 500%+. Our materials guide maps each laminate to its cost tier and application.
Order Volume — 10-20% of Cost Variance
The difference between prototype quantity (5-50 pcs) and production quantity (1,000+) is typically 60-80% in per-unit cost. The crossover point varies by complexity — for 4-layer boards, it's around 200-300 pieces. Our prototype vs production guide explains when it makes economic sense to bridge with a pilot run.
Surface Finish — 8-15% of Cost Variance
HASL (lead-free) is the cost baseline. ENIG adds 15-25%. ENEPIG (for wire bonding) adds 40-60%. Hard gold for edge connectors adds 30-50% on the affected area. See our ENIG vs HASL comparison for when the premium is justified.
Minimum Feature Size — 5-12% of Cost Variance
Moving from 6/6mil trace/space to 3/3mil requires laser direct imaging (LDI) instead of conventional exposure, adding 10-20%. Below 3mil requires modified semi-additive processing (mSAP), adding 30-50%. Via size below 0.2mm requires laser drilling instead of mechanical, adding further cost.
Controlled Impedance — 5-10% of Cost Variance
±10% tolerance is standard. Tightening to ±5% (common in high-speed digital and RF) requires TDR testing on every panel and tighter dielectric thickness control, adding 10-20%. Read our impedance control guide for the engineering behind the cost.
Lead Time — 3-8% of Cost Variance
Standard lead time (5-7 days for production) is the cost baseline. 48-hour expedite typically adds 30-50%. 24-hour service adds 50-100%. The premium isn't just rush charges — it's the cost of breaking production schedules and reserving capacity. DFM optimization reduces re-spins, which is often cheaper than paying for rush turns.
How Volume Actually Affects Per-Unit Cost
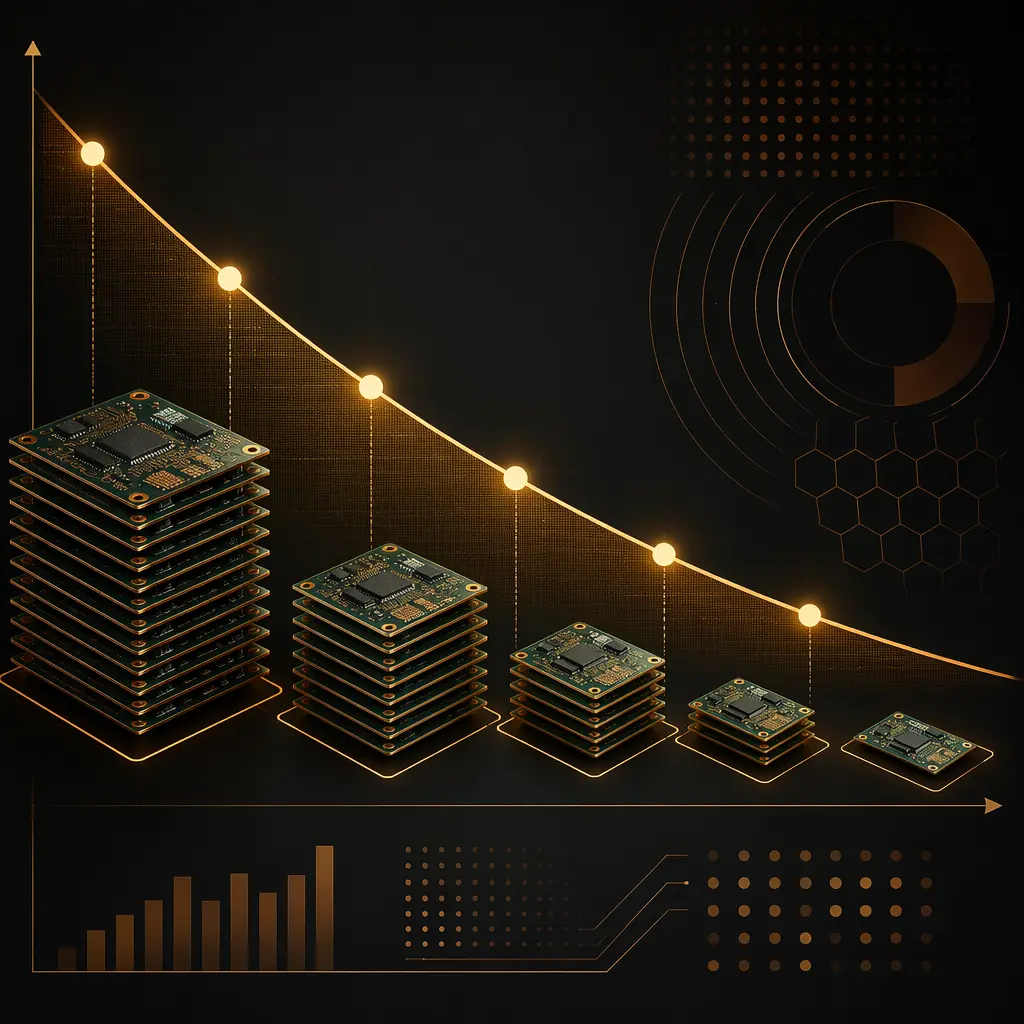
The volume-cost curve is not a smooth line. It has three distinct regions — and understanding these is the difference between a competitive quote and leaving money on the table:
| Quantity Range | Cost Structure | Typical Per-Unit (4L) | Setup Amortization |
|---|---|---|---|
| 1-10 pcs (Prototype) | Setup dominates — film, tooling, and CAM engineering are fully loaded onto a few pieces. | $8-25/pc | 0% amortized |
| 50-200 pcs (Pilot) | Setup costs partially amortized. Panel utilization begins to improve as multiple designs share a panel. | $3-12/pc | 40-60% amortized |
| 500-2,000 pcs (Production) | Setup costs fully amortized. Material and labor become the dominant factors. Panel layout optimized for maximum utilization. | $1.50-6/pc | 90-100% amortized |
| 5,000+ pcs (Volume) | Marginal cost approaches raw material + direct labor. Dedicated production runs. Material sourcing optimized for the specific design. | $0.80-3/pc | Fully amortized + volume discount |
The key insight: the biggest cost drop happens between prototype and pilot quantities (10 → 200 pieces), not between pilot and volume. A 100-piece pilot run captures roughly 70% of the achievable volume discount. If you need to validate a design before committing to 5,000 units, 100-200 pieces is the economic sweet spot — not 10.
Procurement Tip: Always request quotes at three quantity breaks: 50 pcs, 500 pcs, and 5,000 pcs. The ratio between these numbers reveals the supplier's setup cost vs. marginal cost structure. A factory quoting $12 at 50pcs and $8 at 5,000pcs has high setup costs and efficient production — exactly what you want for quality-critical designs. A factory quoting $4 at both quantities is cutting corners or doesn't understand their own costs.
Material Selection: Where the Cost Hides
Material cost is more than laminate price per sheet. The real cost impact comes from three often-overlooked factors:
1. Copper Weight Cascades Through the Entire Process
Moving from 1oz to 3oz copper increases material cost by roughly 60%, but the total manufacturing cost impact is closer to 120% because: etch time increases (slower throughput), plating thickness must increase proportionally, and heavier panels stress handling equipment. At 6oz copper, you're also limited to larger minimum trace widths (10/10mil minimum vs 3/3mil for 1oz), which may force a larger board size. Our facility handles up to 6oz copper across boards up to 600×800mm.
2. High-Tg Materials Require Different Process Parameters
High-Tg FR-4 (170-180°C) requires higher lamination temperature and pressure, longer cure cycles, and more aggressive desmear chemistry. These process differences add 20-30% to manufacturing cost beyond the material price premium. For boards that will see soldering temperatures above 260°C (lead-free reflow, multiple reflow cycles), this premium is not optional — standard FR-4 will delaminate.
3. Mixed Material Stack-ups Are the Hidden Budget Killer
Combining FR-4 with Rogers or PTFE in the same stack-up creates three cost multipliers: different CTE (coefficient of thermal expansion) values require specialized lamination cycles to prevent warpage, different drilling parameters between materials, and different desmear/plating adhesion characteristics. A 6-layer board with 2 Rogers layers typically costs 3-4× more than an all-FR-4 equivalent — not 2× as the material price difference would suggest.
The 5 Cost Optimization Levers (That Don't Sacrifice Quality)
Cost reduction is not about finding the cheapest supplier. The highest-impact optimizations happen at the design stage — before a single Gerber file reaches the factory:
Panel Utilization — The Free 15-25% Savings
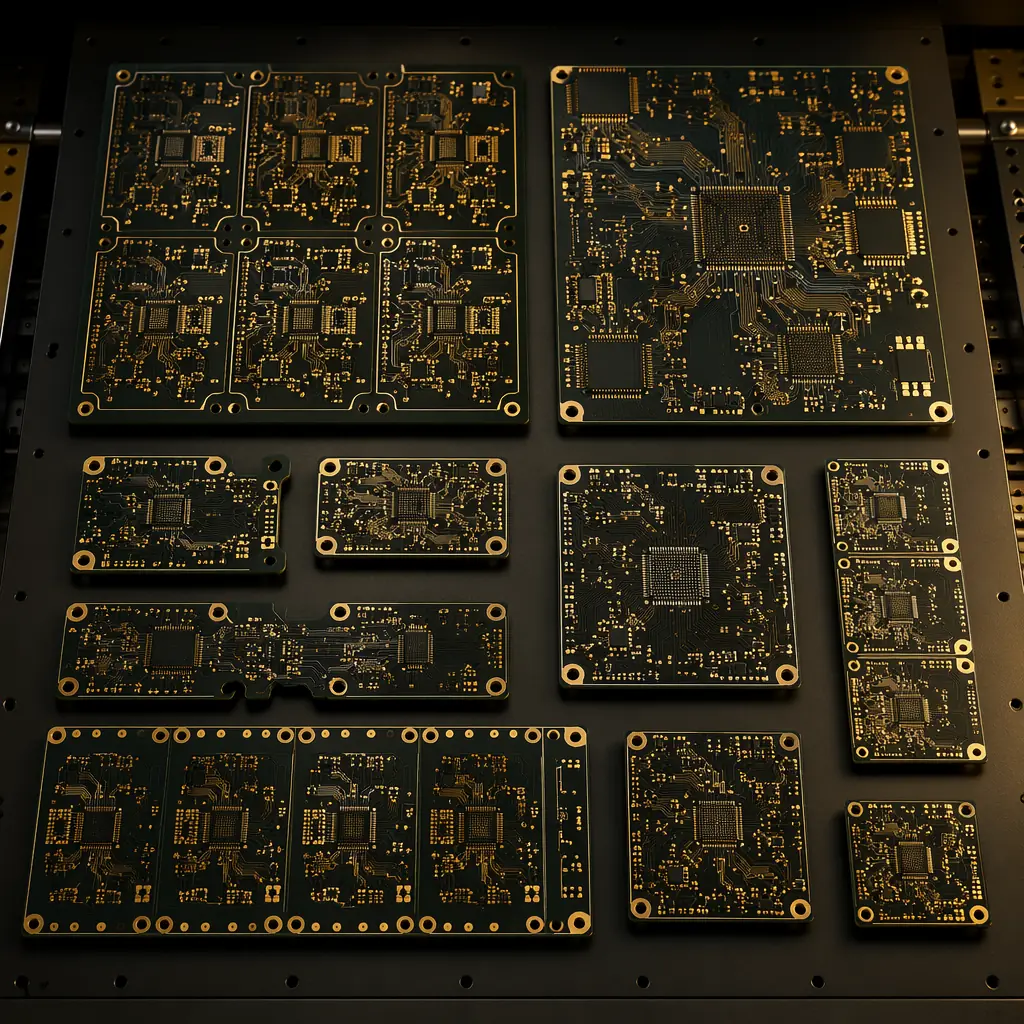
PCB manufacturers price by panel, not by individual board. If your board dimensions waste 30% of a standard 18×24" panel, you're paying for that wasted material on every order. Adjusting board outline by even 2mm in one dimension can increase panel yield from 70% to 85% — a 21% effective cost reduction with zero quality impact. Our DFM guide includes panelization optimization rules.
Layer Count Reduction — Consolidate, Don't Eliminate
Going from 8 layers to 6 layers saves roughly 20% — but only if your design can absorb the loss of routing channels without forcing tighter trace/space rules. The common mistake: reducing layers but then needing 3/3mil traces to fit the routing, which adds back most of the savings in LDI costs. The right approach: route at 5/5mil on 6 layers and verify signal integrity before committing.
Surface Finish Right-Sizing
ENIG is the default choice for fine-pitch BGAs and gold wire bonding — but it's overkill for through-hole connectors and 0.8mm pitch QFPs. Selective ENIG (ENIG on fine-pitch areas, OSP elsewhere) can save 10-15% on boards with mixed component types. See our surface finish comparison for application-specific recommendations.
Via Technology Optimization
Blind and buried vias in HDI designs add roughly $15-25 per lamination cycle. Using via-in-pad with filled and capped microvias costs even more. The optimization lever: limit blind/buried vias to the layers where they're actually needed. A 10-layer board with blind vias only on layers 1-2 and 9-10 costs significantly less than one with vias between every layer pair. Our HDI technology guide covers when each via type pays for itself in routing density gains.
Test Strategy Alignment
Flying probe testing costs roughly $0.50-2.00 per board in setup + test time. Dedicated test fixtures cost $200-800 upfront but reduce per-board test cost to $0.10-0.30. The crossover point is around 300-500 boards. For volumes below this, flying probe is cheaper. Above it, the fixture pays for itself on the first production run. Ordering a fixture for a 50-piece prototype order is pure waste.
When Paying More Is Actually Cheaper: The Total Cost Fallacy
Procurement teams are trained to minimize unit price. But in PCB manufacturing, three higher-cost options consistently reduce total program cost:
1. IPC Class 3 manufacturing (vs Class 2): The per-board premium is typically 15-30%, but the field failure rate drops from roughly 500-1,000 ppm to under 50 ppm. For a product shipping 100,000 units with a $200 field replacement cost, Class 3 saves $900,000-1,900,000 in warranty costs — on a $30,000-60,000 PCB cost premium.
2. 100% AOI + X-ray (vs sampling inspection): Adds roughly 5-8% to PCB cost, but catches BGA voiding, insufficient solder, and tombstoning before boards leave the factory. One undetected BGA short across a production lot can cost $50,000+ in rework and line downtime.
3. Full lot traceability (vs batch-level): The per-board cost is negligible (< 1%), but when a laminate lot issue is discovered, tracing it to the exact 173 affected boards — vs. recalling all 5,000 from that production week — is the difference between a supplier notification and a full product recall. For a proper supplier audit, verify traceability systems during the factory visit, not from the certification binder.
Getting an Accurate Quote: What to Include in Your RFQ
The difference between a quote you can budget against and one you'll regret starts with what you send. Here's what a factory actually needs to provide an accurate price — and what happens when you omit each item:
- Gerber files (all layers) + drill file: Without these, any quote is a rough estimate with a ±40% accuracy range. Layer count alone is not enough — a 6-layer board with 3/3mil traces and blind vias costs 3× more than a 6-layer board with 8/8mil and through-hole only.
- Stack-up specification: Material type per layer, finished thickness, copper weight per layer. Missing this → the factory assumes standard FR-4 1.6mm 1oz, which may be wrong for your application.
- Surface finish: "ENIG" is enough. "Whatever's cheapest" leads to lead-free HASL, which is unsuitable for fine-pitch components.
- Quantity and delivery schedule: Single delivery vs. scheduled releases changes panel optimization and inventory strategy. Stating "5,000 pcs over 12 months in quarterly releases" gets a different price than "5,000 pcs one-time."
- IPC class and any special requirements: Class 3, controlled impedance, impedance test coupons, microsection reports — each adds defined cost. Stating them upfront avoids requote cycles.
At Huaxing PCBA, we respond to RFQs within 24 hours with a detailed quote, DFM review, and process engineer consultation. Our quoting system factors all seven cost drivers automatically from your Gerber data — so the price you see reflects actual production economics, not a sales estimate.